Input errors
A single error counter only answers the question "there is a problem on the input". For a headend that is not enough: the cause decides who to call. Lost packets are the network, a refused connection is the partner, a handshake timeout is their encoder or the firewall between you.
So input errors are counted by cause, and every cause is its own line on the chart and its own series in the metrics.
Two families of causes
- Media defects of a live stream — the data arrives but is damaged:
lost_packets,broken_payload,desync,ts_pat. - Source failures — there is no data, and the cause of death is named:
connection_closed,connection_refused,timeout,http_request_error,not_found,denied,decode_error,protocol_error,io_error,other.
The difference is practical. The first family means the signal is running and has to be fixed at the transport level — the TR 101 290 counters are the next place to look. The second means there is no signal at all, and it is the connection that has to be fixed.
How this is counted:
- the classification comes from the typed error category, not from the log text — rewording a message does not break the counter;
- a failure to open a source also lands in the detail, not only a failure of an already running connection;
- every failure also enters the aggregate
errorscounter, so the sums add up; - repeated failures on retries are counted each time: the rate of events is exactly the signal "the source is still dead";
- orderly stops — reconfiguration, end of stream, pre-emption by a higher-priority input — are not counted as errors.
The chart on the stream card
The Source errors panel on the Sources tab draws errors per minute as separate lines by cause. Causes with no events take no place in the legend — the chart shows exactly what is happening.
The minutes in which the input frame rate was zero are highlighted as an outage. That answers a question a single error counter never closes: were these errors on a live signal, or was there no signal at all at that time.
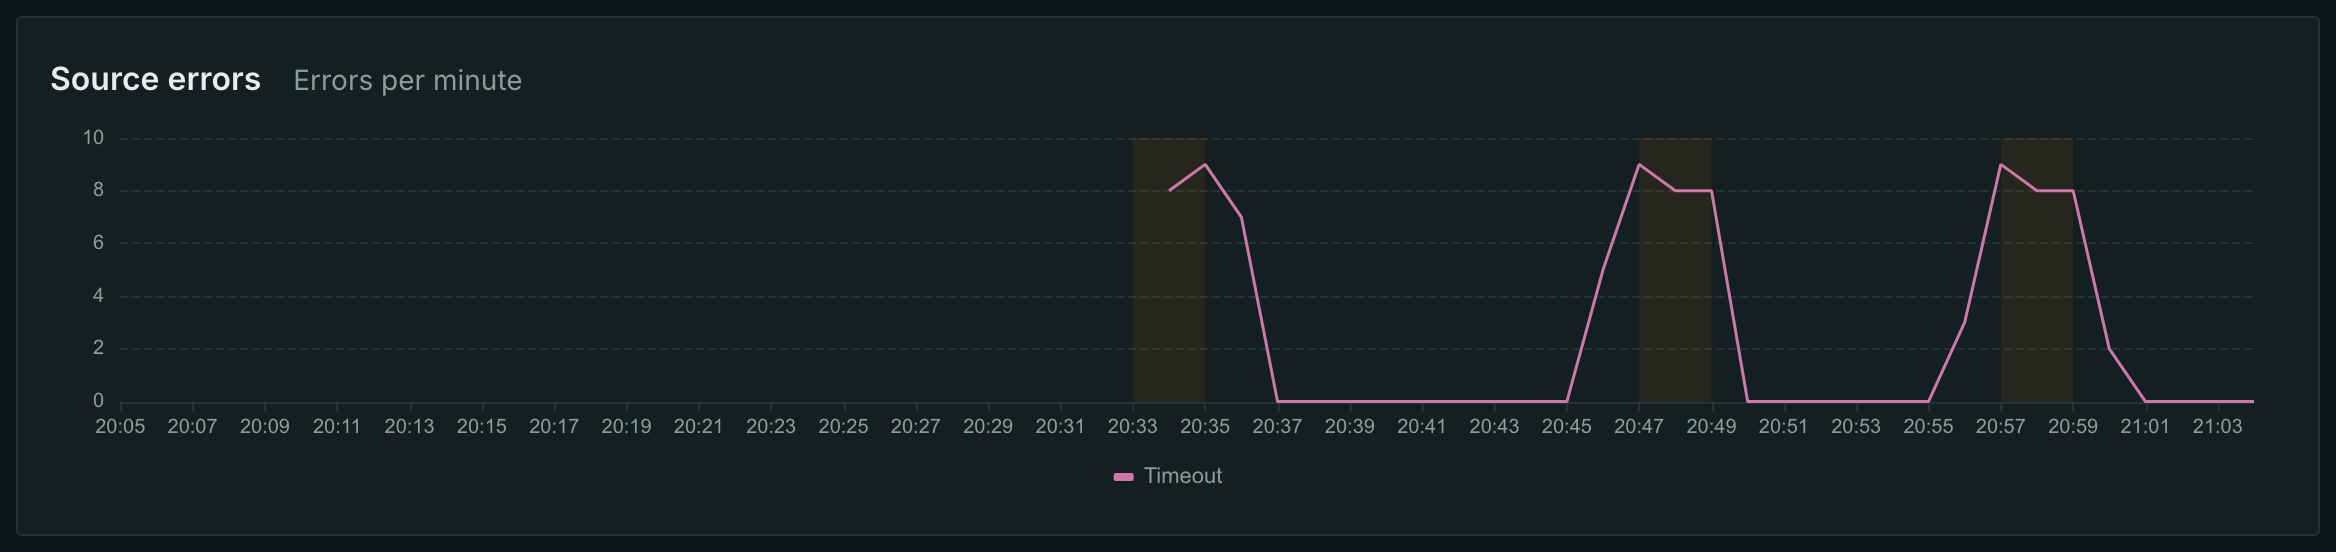
An unreachable HLS or HTTP MPEG-TS source gives http_request_error on every retry, an SRT handshake failing by timeout gives timeout:
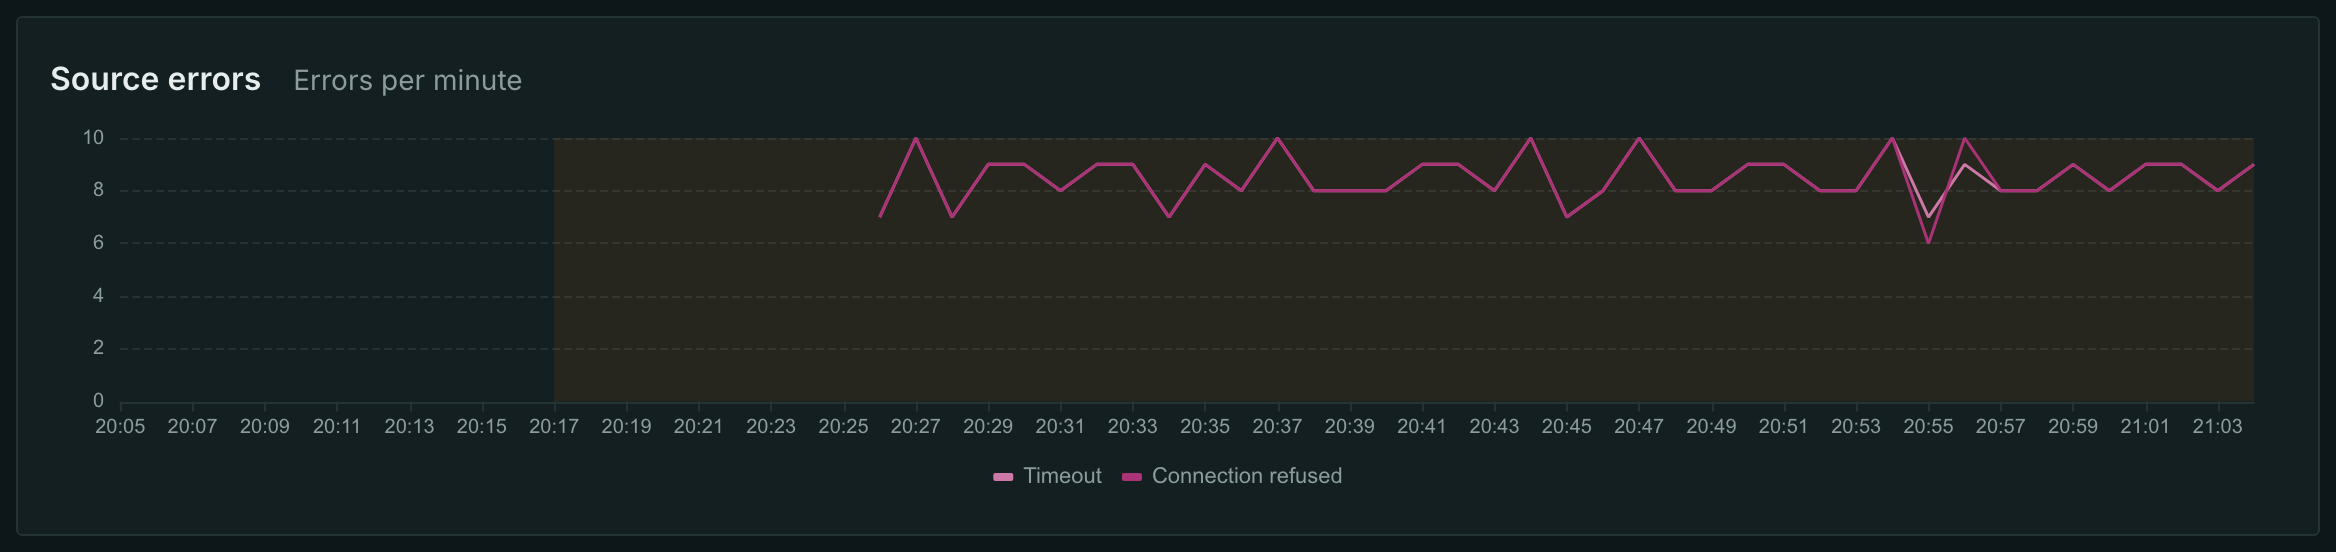
Without the extended counters option the panel shows a single aggregate line; the detailed lines appear together with the option.
The metrics series
In the built-in Prometheus server the detail travels as one series with a cause label — errors_detail_total{name, cause}; when there is more than one station, the series also carry node. Causes with no events create no series.
# stream errors over 5 minutes broken down by cause
sum by (cause) (increase(errors_detail_total{name="tv1"}[5m]))

# every input currently seeing connection failures
sum by (name) (rate(errors_detail_total{cause="connection_closed"}[5m])) > 0
How to read it
| What you see | What it means |
|---|---|
lost_packets with a live bitrate |
the network between the source and the station is losing; use the transport counters to find the affected PID |
timeout in bursts, outage bands |
the source does not answer; every burst is another retry |
http_request_error as a steady comb |
the HTTP source is unreachable: address, DNS, firewall or a dead origin |
connection_closed on a live stream |
the partner is tearing the connection down; look at their side |
denied, not_found |
access or path: the key, the streamid, the resource name |
desync, broken_payload |
the data arrives broken — the transport or the encoder on the other side |
A single error on the chart is normal for a network. The diagnosis comes from the shape: a steady comb of one cause, bursts around the outage bands, growth while the bitrate stays the same.
What next
- Input redundancy — how to turn the diagnosis into a switch.
- TR 101 290 — per-PID transport counters.
- Monitoring — where these counters go and how to alert on them.