Delivery monitoring
A headend cannot ask the receiver what it measured. All it has are its own sending counters, and they are taken per destination.
The statistics key is the pair "stream name, destination name", the same one as in the destination's settings. This is not a formality: one stream goes to five destinations, and the sentence "the stream is pushing 40 Mbit/s" does not answer whether it reaches any particular one of them.
The push statistics option
The delivery view is a separate licence option. It cuts only the data channels: the pushes section and the flat push_* fields in the API, the stream_push_* series in the scrape and in the built-in Prometheus server. The collection itself never stops, and the counters always go into the Retroview telemetry — the analysis in Retroview is available without the option too.
The view in the panel
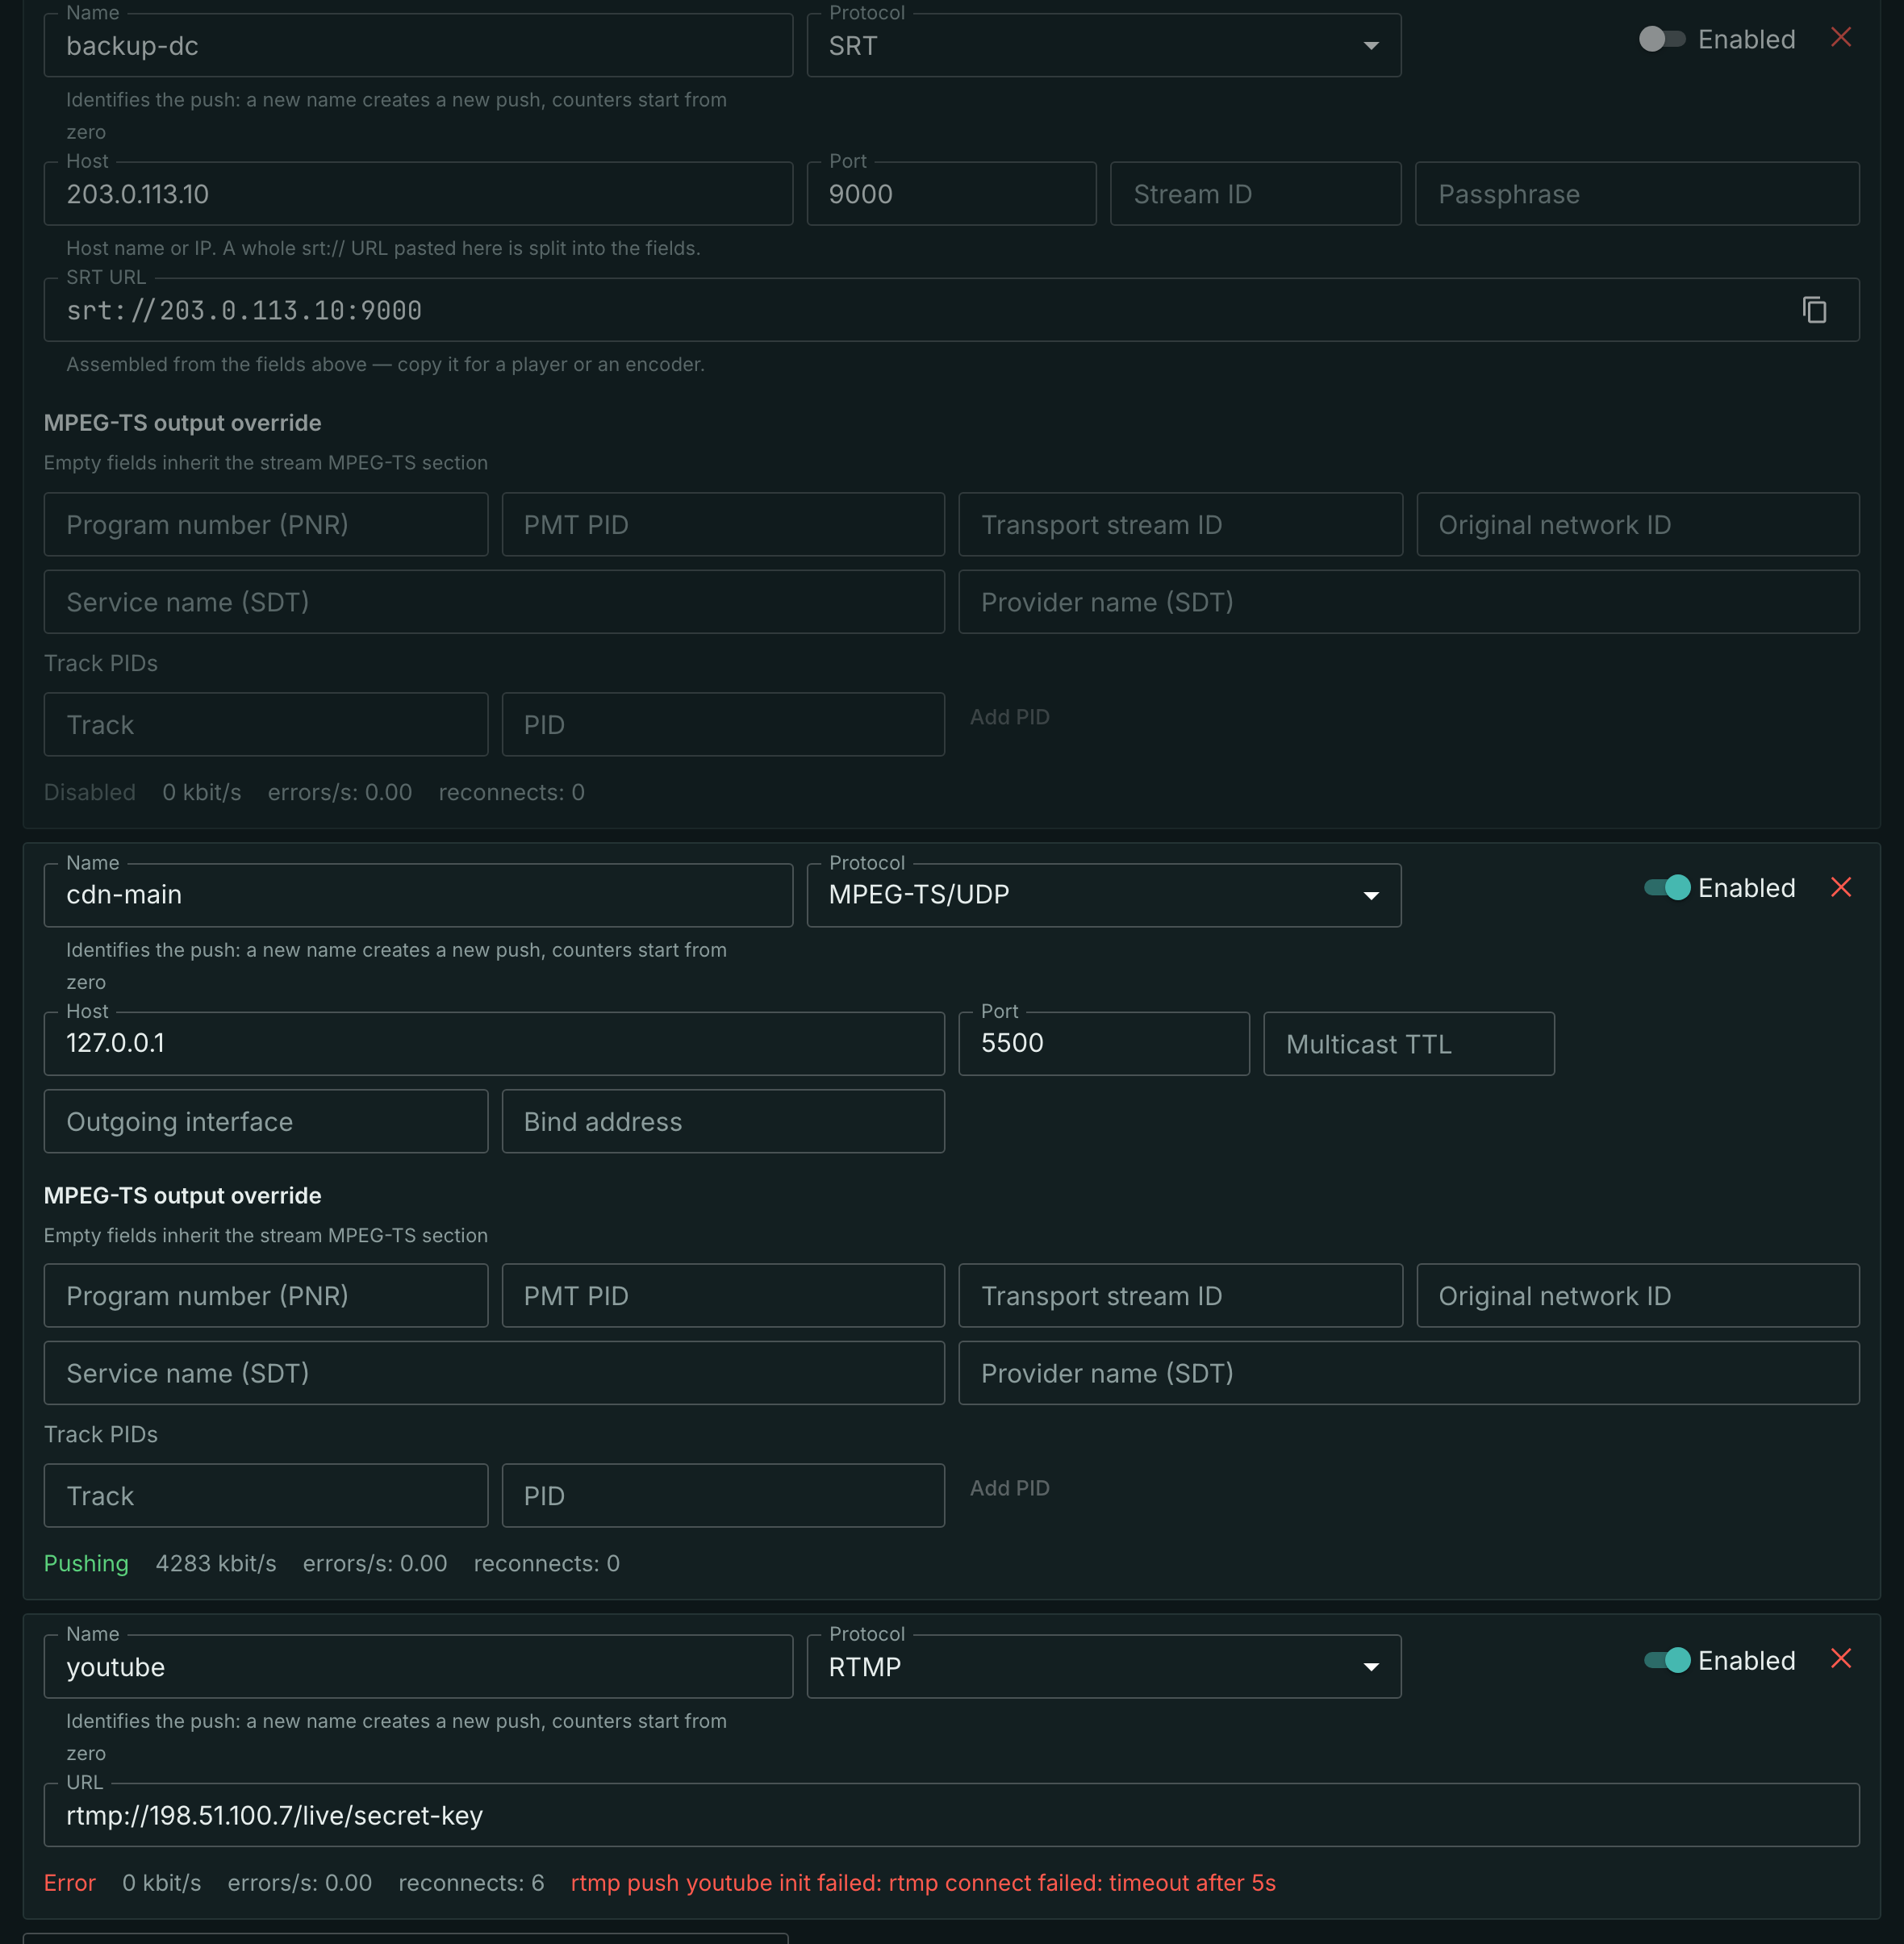
On the Egress tab a live statistics line runs under every destination's settings: status, rate, errors per second, reconnects, and for a failed one the reason right there in the line.
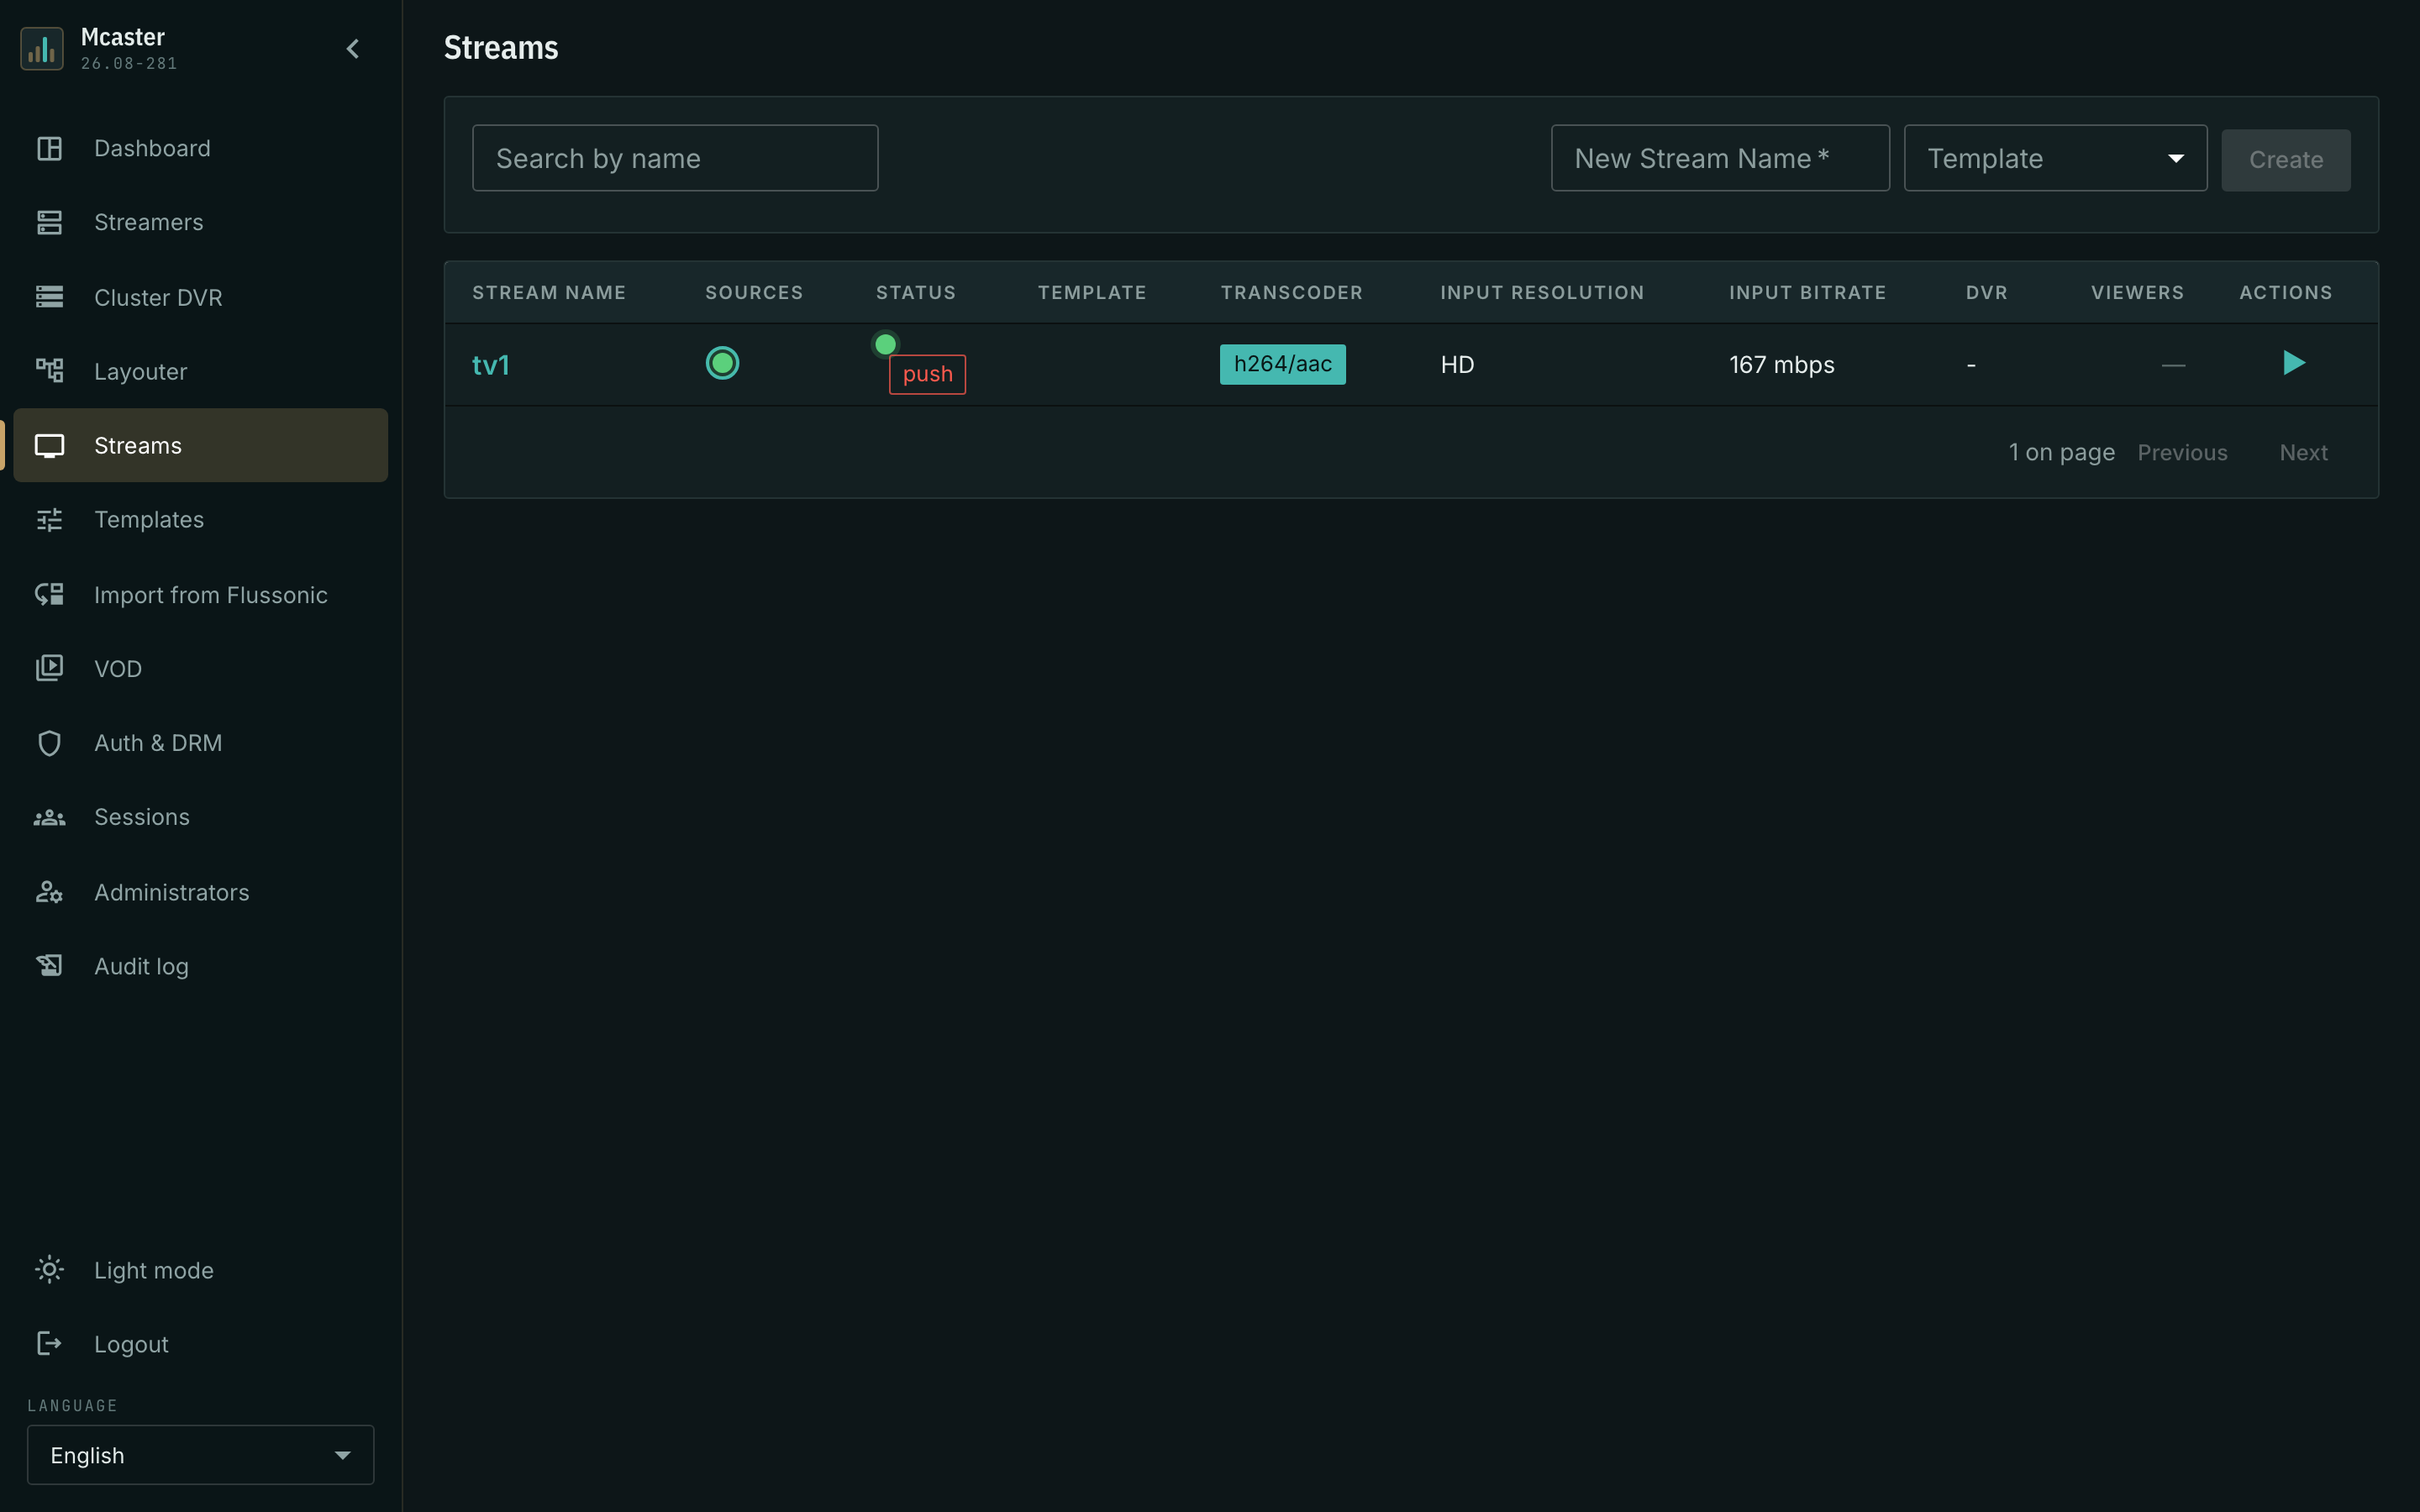
In the stream list a broken destination lights a mark next to the stream status: you can see that delivery is broken without opening the stream.
Destination counters
GET /streamer/api-v4/streams/stats/{name} carries an object keyed by destination name:
"pushes": {
  "cable-net": {
    "status": "running",
    "proto": "udp",
    "url": "udp://239.1.1.10:5000",
    "opened_at": "2026-08-13T11:17:53Z",
    "bitrate_kbit": 2113.4,
    "bytes_total": 19053048,
    "datagrams_total": 14478
  },
  "partner-dc": {
    "status": "error",
    "proto": "srt",
    "url": "srt://203.0.113.10:9000",
    "error": "srt handshake rejected: bad passphrase",
    "reconnects_total": 22
  },
  "backup-site": {"status": "disabled", "proto": "srt", "url": "srt://198.51.100.4:9000"}
}
| Field | What it means | How to use it |
|---|---|---|
status |
running, error or disabled |
not running for longer than N minutes — alert; disabled is normal, it is a destination the operator turned off |
error |
the reason for the error status |
the first thing to read: connection refused, timeout, handshake rejected |
proto, url |
the transport and the destination exactly as the operator set them | you can see where the signal actually goes |
opened_at |
when the current pusher started | it gets younger on every reconnect — the channel is flapping |
bitrate_kbit |
the measured sending rate | noticeably below the stream's bitrate — the sending is not keeping up |
errors_rate |
sending errors per second | growing on a live connection — the receiver or the channel is degrading |
bytes_total |
bytes sent, cumulative | reconciling volumes per destination |
errors_total |
sending errors, cumulative | — |
reconnects_total |
revivals of a dead pusher | growing while status: running — the channel breaks and recovers |
retransmitted_packets_total |
transport retransmits (SRT, RIST) | growing — losses on the path to the receiver |
datagrams_total, frames_total |
the units sent: datagrams for packet transports, frames for RTMP | — |
Zero fields are omitted from the answer: an RTMP destination has no datagrams, a UDP one has no frames and no retransmits.
Next to the stream counters there are three sums over all destinations — push_bytes_total, push_errors_total, push_reconnects_total. They answer "how much did the station send at all" without walking the map.
Prometheus series
Every destination counter is its own series with a push label:
| Series | Labels |
|---|---|
stream_push_bytes_total |
stream, push, proto |
stream_push_errors_total |
stream, push, proto |
stream_push_reconnects_total |
stream, push, proto |
stream_push_retransmitted_packets_total |
stream, push, proto |
stream_push_datagrams_total, stream_push_frames_total |
stream, push, proto |
In the built-in Prometheus server the same counters are available with the name (stream) and push labels; when there is more than one station, node is added. The protocol depth — stream_push_srt_* and stream_push_rist_* — arrives together with the extended counters option.
# sending rate per destination — the node scrape, label stream
rate(stream_push_bytes_total{stream="tv1"}[1m])

# the stream's total egress across all destinations — the built-in server, label name
sum by (name) (rate(stream_push_bytes_total{name="tv1"}[1m]))

# flapping channels: reconnects over five minutes
increase(stream_push_reconnects_total[5m]) > 0

# losses on the path to the receiver over SRT/RIST
rate(stream_push_retransmitted_packets_total[1m])
How to read the state
status: errorwith a non-emptyerror— nothing is being sent, and the reason is named. The destination keeps coming back up by itself, once every five seconds.status: runningbutbitrate_kbitis zero — the connection is there, the data is not: check whether the signal is arriving on the input.status: runningwith a growingreconnects_total— the channel breaks and recovers;opened_atshows the age of the current connection.status: disabled— the destination is turned off with the switch. The counters are frozen at their last values; this is not data loss.
The alerts to start with
| Question | Where to look | The sign of trouble |
|---|---|---|
| Does the signal arrive? | pushes[].status, bitrate_kbit; rate(stream_push_bytes_total[1m]) |
the status is not running; the rate is zero on a live stream |
| Why does it not? | pushes[].error |
the reason text: connection refused, timeout, handshake rejected |
| Is the channel breaking? | reconnects_total, opened_at |
reconnects grow; opened_at gets younger every few minutes |
| Is the path losing packets? | retransmitted_packets_total |
grows while the status stays stable |
| Is the egress keeping up? | the destination's bitrate_kbit against the stream's bitrate |
the destination's rate is systematically lower |
What next
- Delivery to the network and SRT delivery — what a destination is configured with.
- Input errors — the other half of the picture: what arrives at the station.
- Monitoring — the statistics channels as a whole.