Multiplexer Monitoring
The Multiplexer monitoring dashboard shows how MPEG-TS multiplexers are performing: whether channels fit within the configured CBR bitrate, whether service tables are being generated, and whether data is lost during program packaging.
Unlike input monitoring, this is not about individual incoming streams, but about the finished multiplex — the MPTS sent to a cable network, modulator, or UDP. Issues on these graphs mean subscriber equipment may fail to lock onto the signal or specific channels may show artifacts.
The recommended workflow: start with the heatmap of multiplexers with the most errors, then review aggregated server graphs, and after selecting a specific multiplexer — drill down to program and PID error details at the bottom of the dashboard. You can click a cell on the heatmap to open the same dashboard with that multiplexer already selected.
Multiplexer Errors
The Top N multiplexer with errors on server panel is the main entry point for diagnostics.
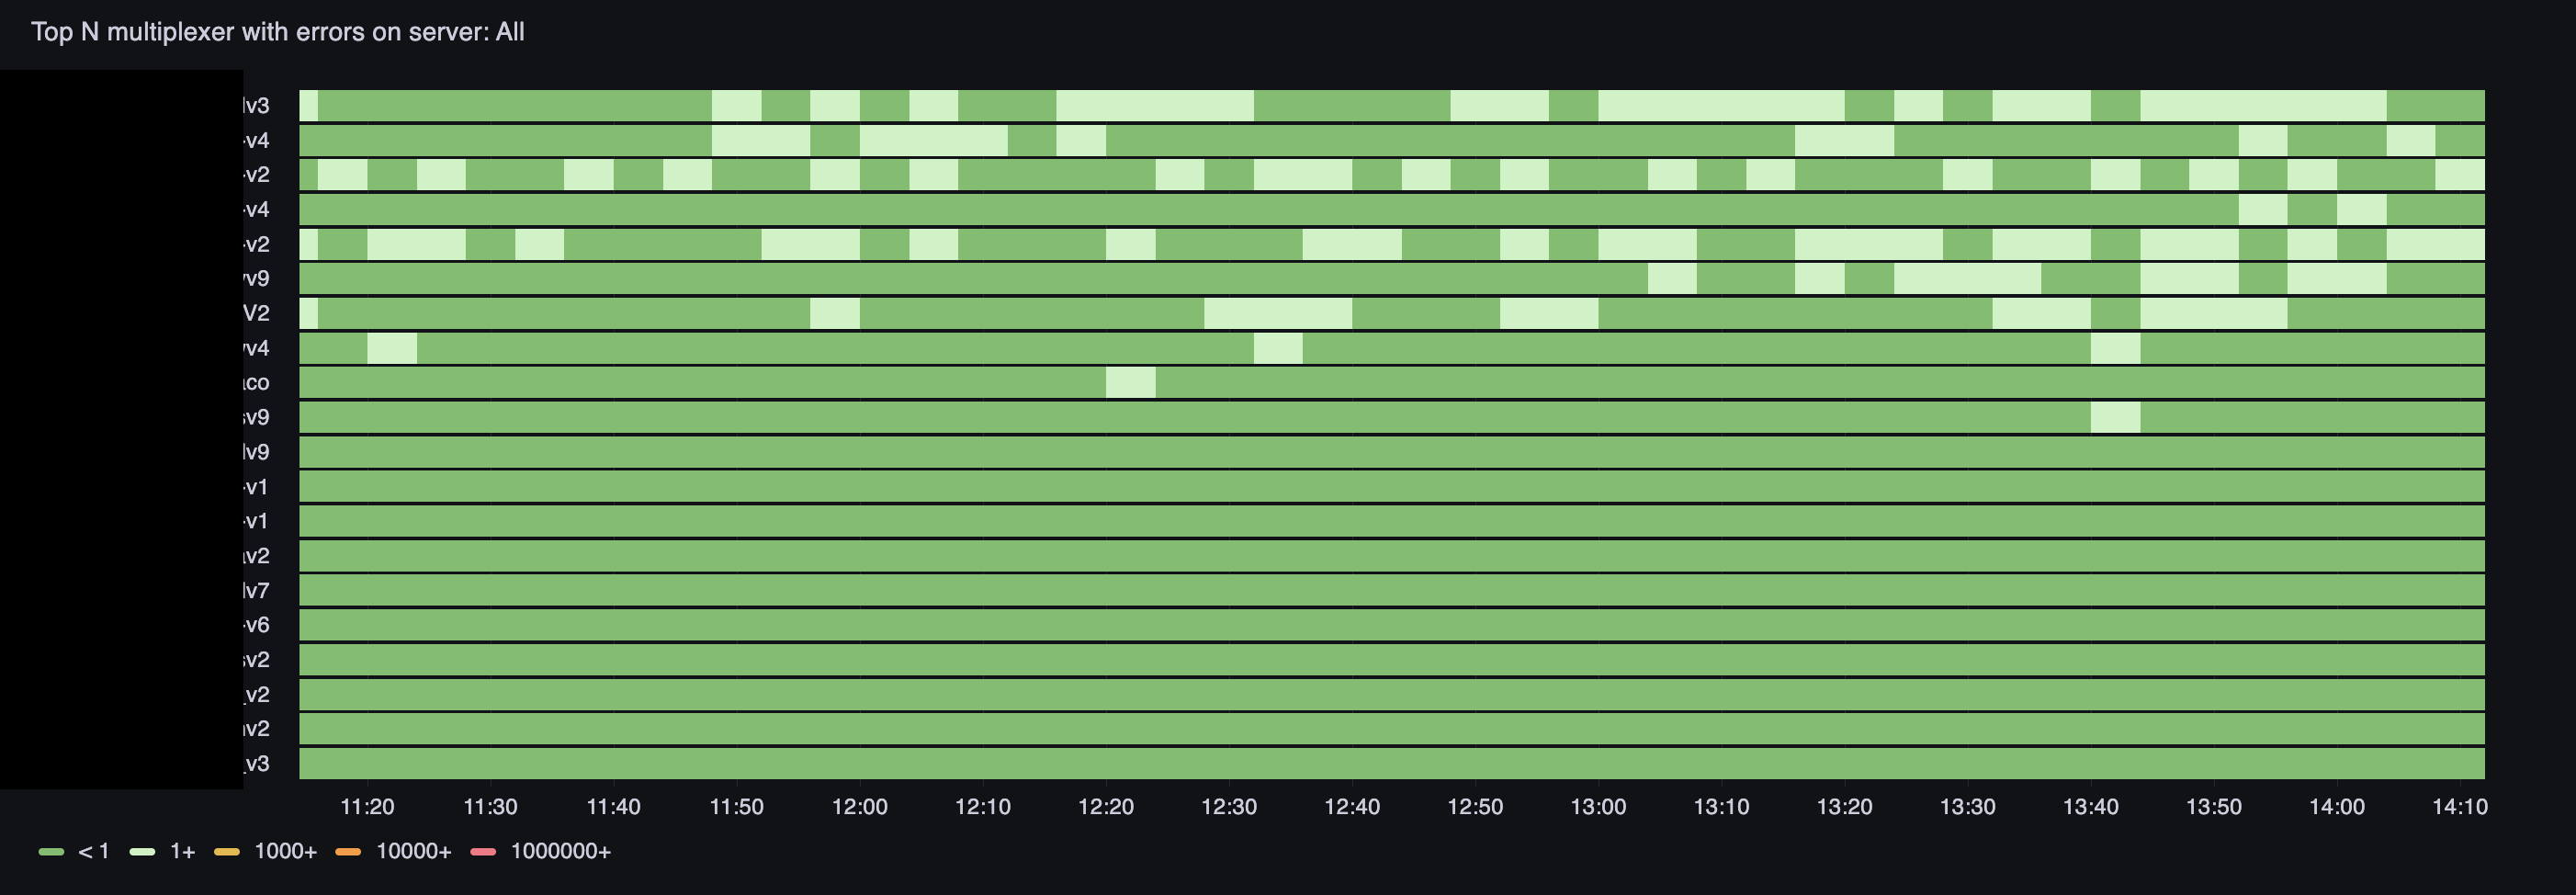
This is a heatmap (state timeline): multiplexers with the most errors are listed vertically, time runs horizontally. Cell color shows how many multiplexer_error_count errors accumulated in each interval:
- green — less than one, normal;
- light green — 1 and above, isolated failures;
- yellow — 1000 and above, noticeable problem;
- orange — 10000 and above, serious degradation;
- red — 1000000 and above, critical situation.
Multiplexers with the most errors over the selected period rise to the top. Change the time range: a narrow window (1–3 hours) reveals recent incidents, a wide one (a day or more) shows periodicity and growing trends.
At the top of the dashboard, select Server name — a single server or All for a summary across the entire infrastructure.
Use Cases:
- See yellow and orange blocks, click a multiplexer row, and proceed to error details
- Over several days, notice the same multiplexer regularly in the top — look for a systemic cause (CPU overload, total program bitrate too high, channel source issues)
- Correlate error spikes with trimmed bytes and ts overflow spikes on the server graphs below
Server Overview
The server graph block provides an aggregated view of all multiplexers on the selected server.
Graphs are split by media server version — convenient for checking whether degradation is tied to an upgrade.
Payload
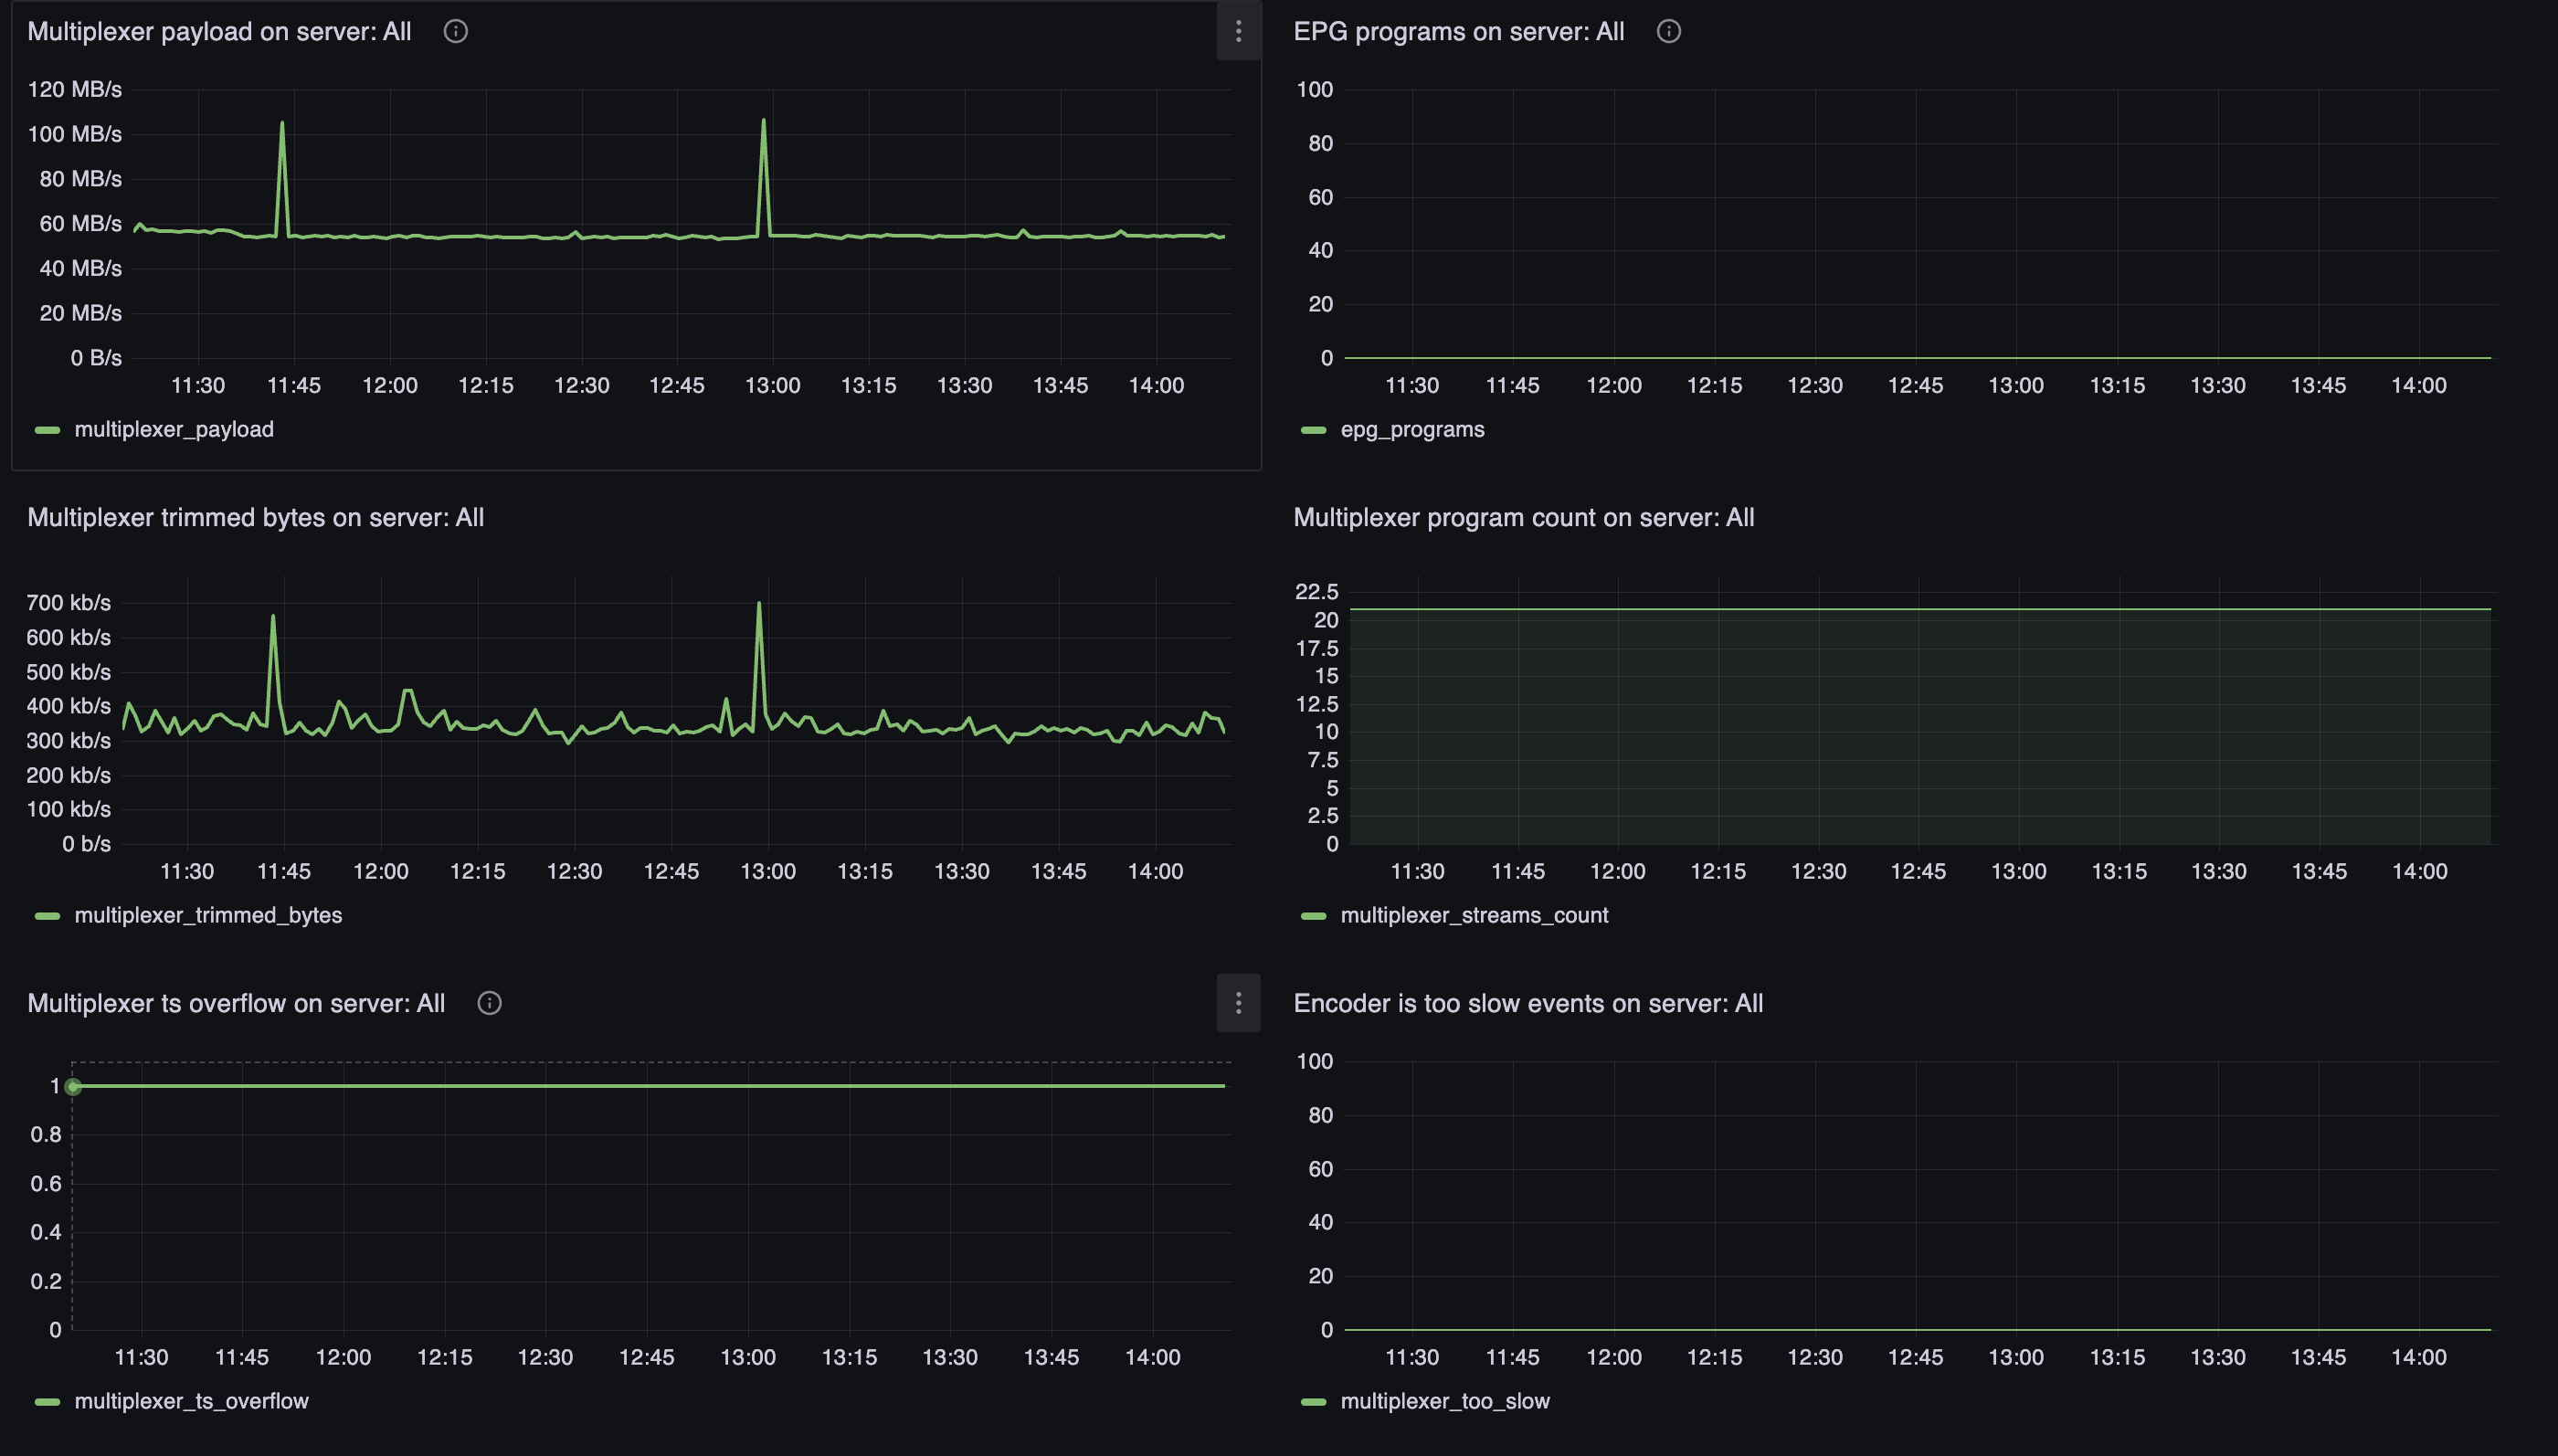
The Multiplexer payload on server graph shows the total volume of useful data in output MPTS streams — the multiplexer_payload metric.
This is not total network traffic, but the bytes of video, audio, and program service data the multiplexer actually packaged into the transport stream. The graph should be stable and match the total bitrate of configured multiplexers. Sharp drops indicate multiplexers stopped or program sources were lost.
EPG
The EPG programs on server graph shows how many programs have an electronic program guide being transmitted (multiplexer_epg_programs).
Zero on the graph means EIT is not being generated for any program. If EPG is configured but the graph stays at zero — check the eit section configuration and XMLTV upload. More on EPG setup in the Mcaster Multiplexer documentation.
Trimmed Bytes
The Multiplexer trimmed bytes on server graph shows the rate of data trimming during packaging (multiplexer_trimmed_bytes).
The multiplexer runs in CBR mode: total bitrate of all programs must not exceed the configured limit. If sources deliver more data than allocated to PIDs, excess bytes are trimmed. Any non-zero value is a warning sign: viewers get degraded quality or dropped frames. Growth in trimmed_bytes together with errors on the heatmap is the first thing to check when complaints mention "breakup" on air.
Program Count
The Multiplexer program count on server graph shows how many programs (TV channels) are currently packaged into multiplexes (multiplexer_streams_count).
The line should be stable and match the configuration. An unexpected drop means a program dropped out of the multiplex (source unavailable, configuration error). Growth without configuration changes — check whether extra multiplexers were added.
TS Overflow
The Multiplexer ts overflow on server graph shows TS overflow events (multiplexer_ts_overflow).
Overflow means the multiplexer did not insert stuffing packets in time and the transport stream exceeded allowed timing boundaries. This violates DVB CBR and PCR requirements. Any non-zero values need attention: reduce total program bitrate, relieve server load, or check whether the encoder keeps up.
Encoder Too Slow
The Encoder is too slow events on server graph counts situations where the encoder cannot keep up with real time (multiplexer_too_slow).
Normal is zero. Any growth means transcoding of one or more programs is falling behind the input stream. The multiplexer is forced to wait for frames or trim data. Check CPU and GPU load on the Server Stats dashboard, reduce the number of programs on the server, or relax transcoding profiles.
Program Details
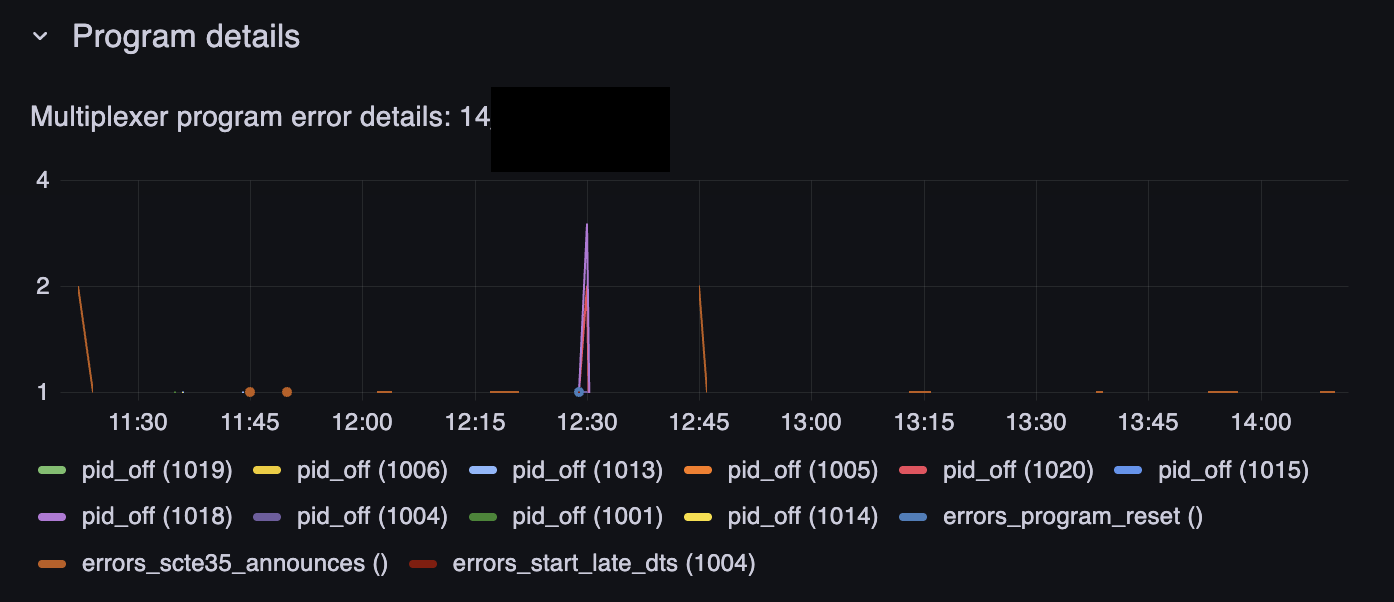
After selecting a multiplexer in the Stream name variable (or by clicking the heatmap), error details appear in the Program details group.
Errors by Program and PID
The Multiplexer program error details graph breaks down multiplexer_errors_count errors by type and channel identifier (channel_id). Each line on the graph is a specific error type for a specific PID or program.
This is where you drill into a case from the heatmap: which errors dominate and when they occur.
Error types you may see on the graph:
- pid_off — a PID is declared in the program configuration but no data arrives on it. The source is not delivering the track (no audio, subtitles, SCTE-35) or the program dropped out of the input stream. Check the channel source and PID mapping in the multiplexer configuration
- errors_program_reset — the program was restarted inside the multiplexer. Often a consequence of prolonged missing input or a change in input stream structure
- errors_scte35_announces — issues with SCTE-35 ad insertion markers. Critical for operators with ad insertion: markers may not reach the headend
- errors_start_late_dts — a frame arrived late relative to DTS, the multiplexer could not package it in time. A sign of overload or an overly aggressive program bitrate
Use Cases:
- Complaint about a specific TV channel in the multiplex: select the multiplexer, find lines with the relevant
channel_idon the graph, and check the error type - Mass pid_off on several PIDs of one program — the channel source degraded or the provider changed stream structure
- Growth in errors_start_late_dts without pid_off — the multiplexer is overloaded on bitrate; check trimmed bytes and ts overflow on the server graphs
- Periodic spikes of errors_program_reset — unstable program source; check input monitoring for the corresponding streams
Set up alerts: watch for error growth on the heatmap and correlate with CPU load and scheduler load — multiplexing and transcoding are heavily dependent on server resources.