DVR Monitoring
DVR dashboards in Retroview show how the archive is performing: whether the server keeps up with recording streams, whether storage delivers data during playback, and which channels generate the main load.
Unlike input monitoring, this is not about incoming signal quality, but about the reliability of storing and serving already recorded video. Issues on these graphs directly affect archive availability for subscribers.
The recommended workflow: start with the overview heatmaps of problematic streams, then review aggregated server graphs, and only after selecting a specific channel — drill down to the detail panels at the bottom of the dashboard.
Archive Write Issues
The Top N streams with dvr write issues panel is the main entry point for recording diagnostics.
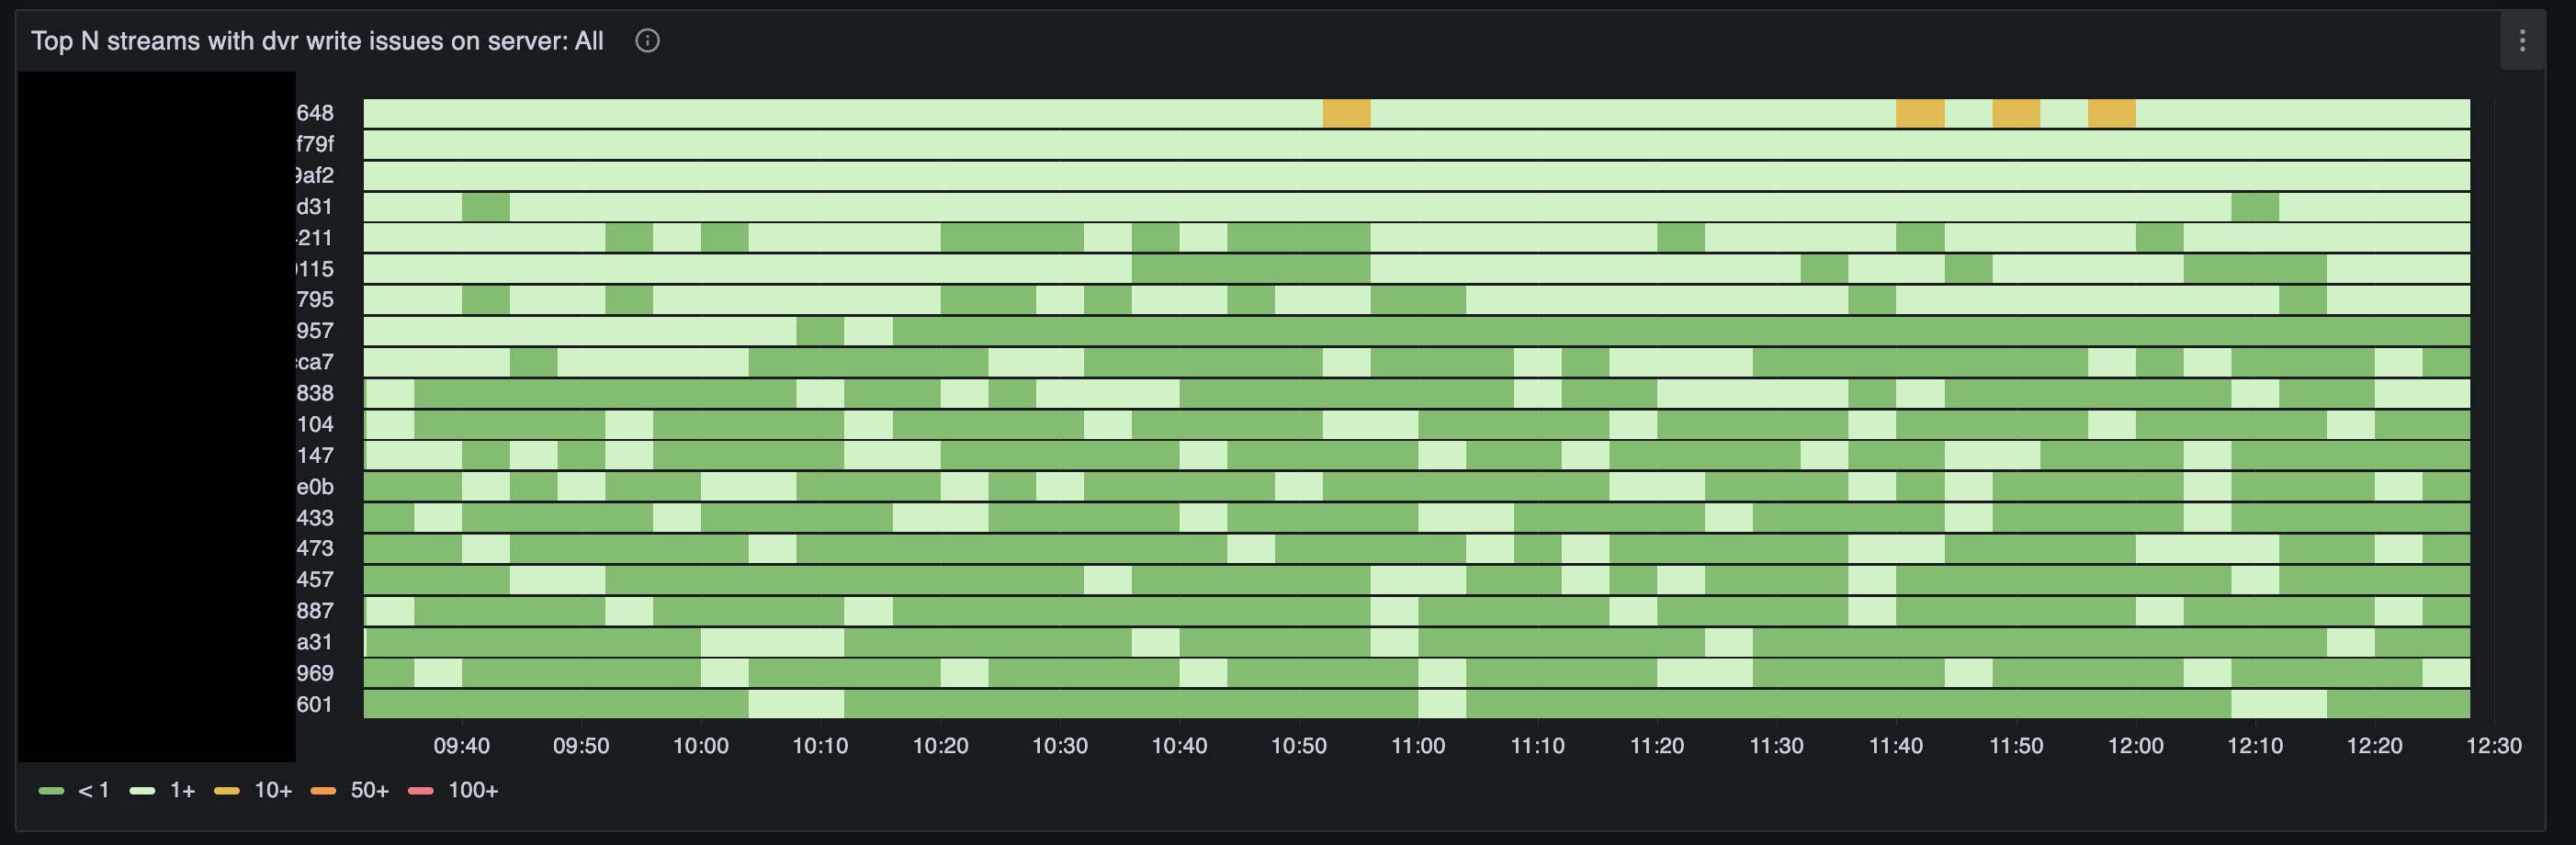
This is a heatmap: streams with the most recording issues are listed vertically, time runs horizontally. Cell color shows how many recording incidents occurred in each interval:
- green — less than one, normal;
- light green — 1 and above, isolated failures;
- yellow — 10 and above, noticeable problem;
- orange — 50 and above, serious degradation;
- red — 100 and above, critical situation.
Streams with the most issues over the selected period rise to the top. Change the time range: a narrow window (1–3 hours) reveals recent incidents, a wide one (a day or more) shows periodicity and growing trends.
Use Cases:
- See yellow and orange blocks on the server, pick the stream from the top row, and proceed to detailed diagnostics
- Over several days, notice the same channels regularly appearing in the top — look for a systemic cause (disk overload, network storage, too many streams on the server)
- Correlate spikes with disk write errors on the Server Stats dashboard
What the write issue types mean (more detail in the Recording Status section of the input dashboard):
- discontinuity — gaps in the stream timeline, playback will have holes in the archive
- slow and delayed — recording succeeded but took too long; storage is at its limit
- collapsed — several segments were written as one block; the disk cannot keep up
- skipped — segments were dropped, video is lost
- failed — writing to storage ended with an error
Set up an alert: The disk issues alert will warn about collapsed writes before failed writes appear and archive is lost.
Archive Read Issues
The Top N streams with dvr read issues panel shows streams where archive playback most often produces errors.
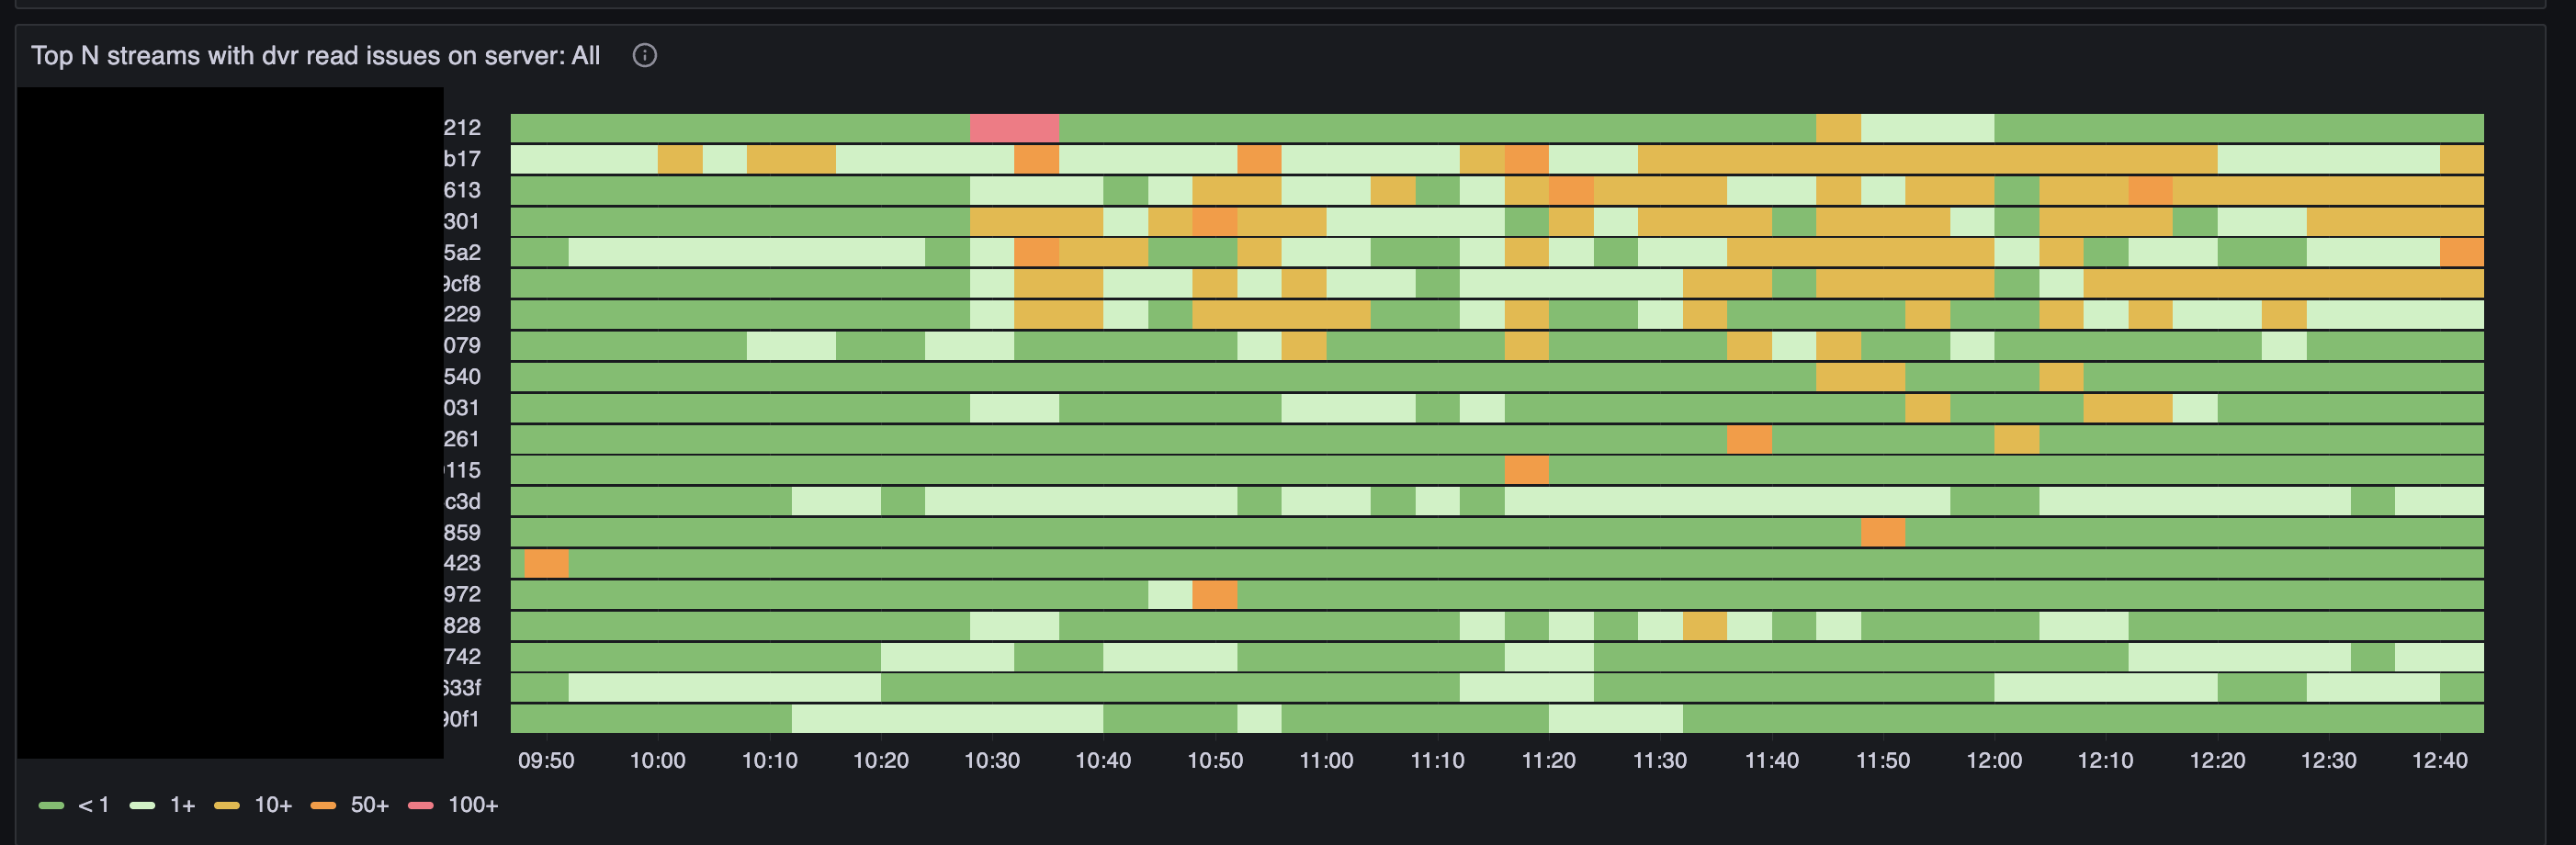
The layout matches the write issues heatmap: streams are sorted by incident count, color scale runs from < 1 to 100+.
Read errors and write errors are different things. A stream may record to the archive normally but fail during playback: missing segments, slow storage, replication problems. And vice versa — a stream with write issues will eventually start producing read errors too.
Use Cases:
- Subscribers complain that "the archive won't open" or "video keeps cutting out" — find the channel on this map and drill down
- See read errors rising simultaneously on many streams — likely a shared storage or network problem, not a single camera
- Distinguish a stream with a single red block (one-off incident) from a stream with a continuous yellow band (chronic problem)
Read error types:
- enoent — the requested archive segment was not found on disk. Common causes: recording did not keep up, a segment was skipped, or the archive on another server has not replicated yet
- slow and delayed — the segment was found but reading took too long; disk or network cannot keep up
- failed — read ended with an I/O error
- fast — normal fast read; this line should not appear on the graph together with errors
Popular Archive Read Streams
The Top N popular DVR read streams panel shows which channels are watched from the archive most often.
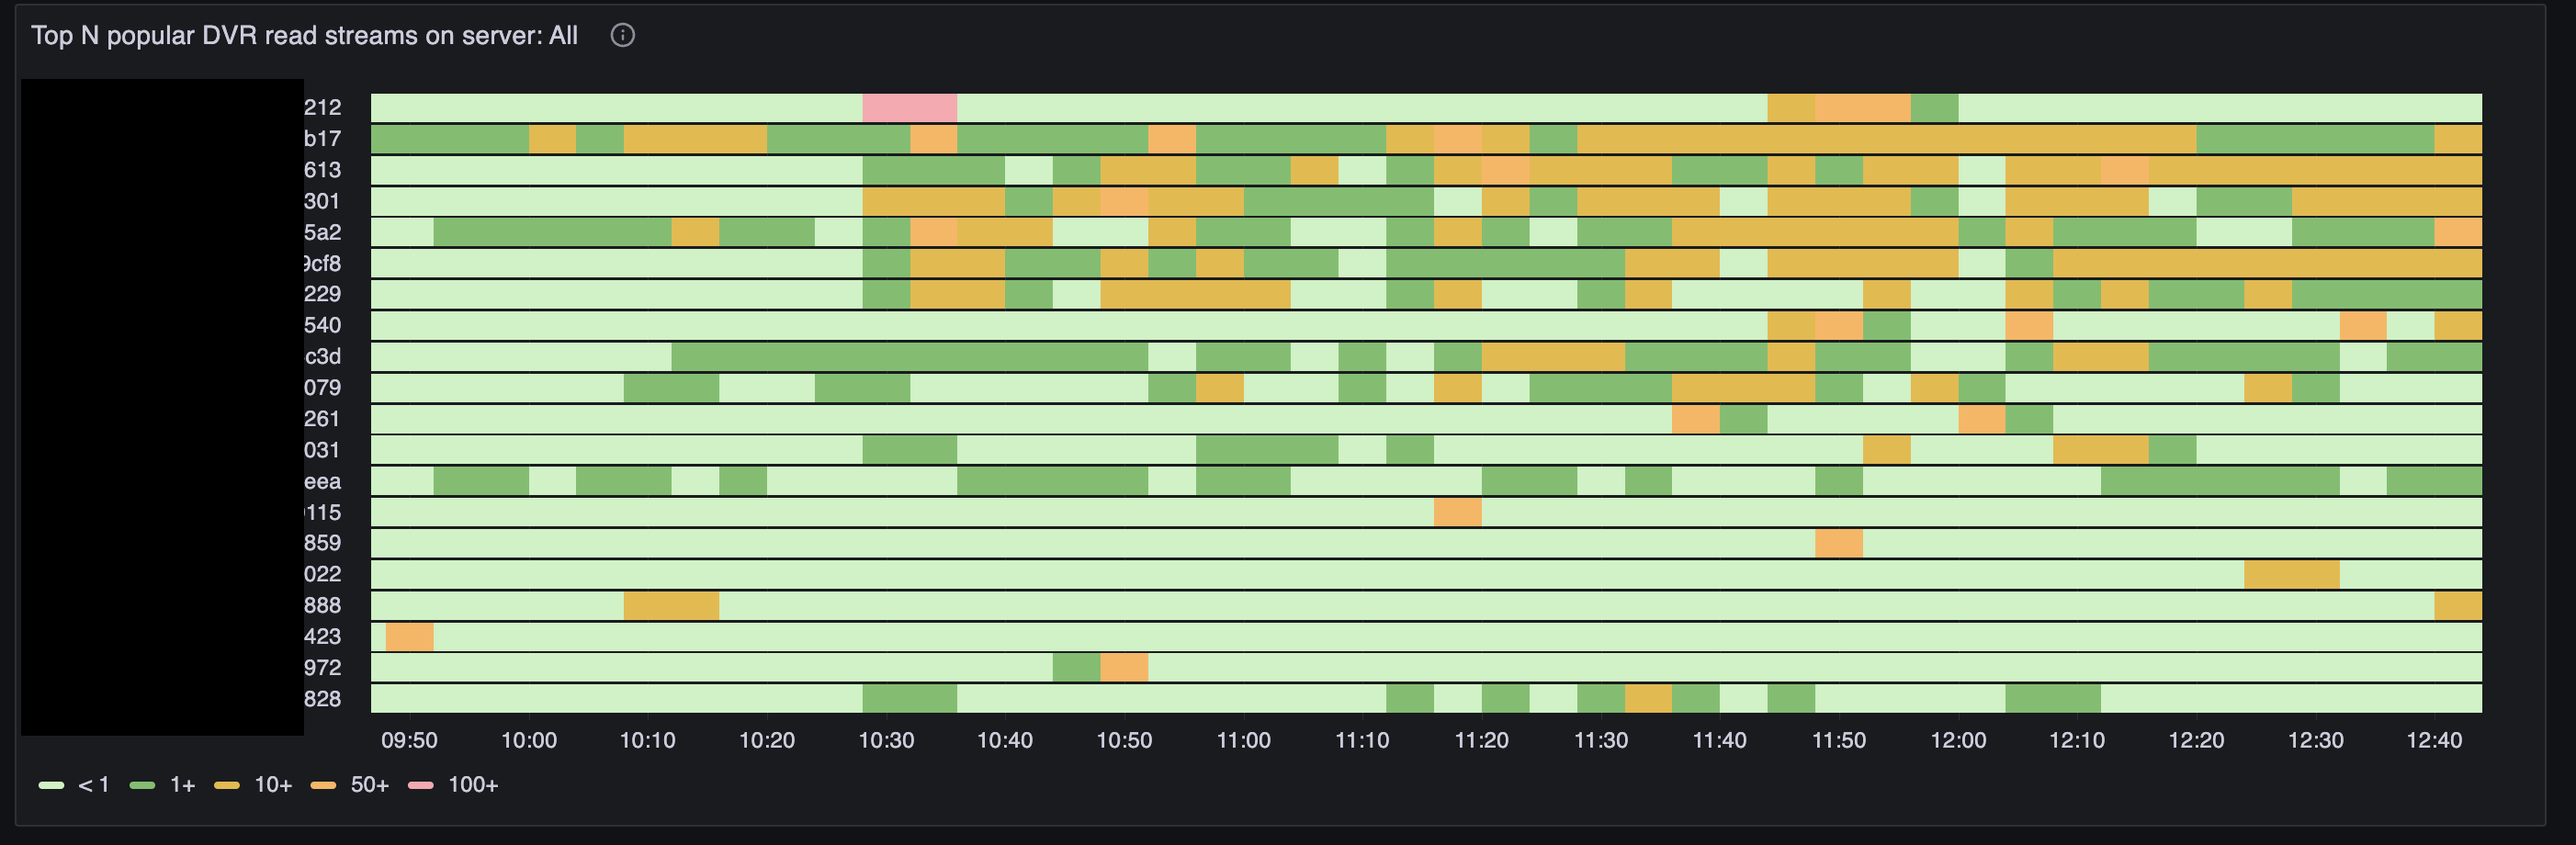
Here color reflects not errors but the number of simultaneous archive reads per stream:
- green — less than one, the stream is rarely watched from the archive;
- light green — 1 and above, occasional views;
- orange — 10 and above, noticeable load;
- dark orange — 50 and above, high load;
- pink — 100 and above, peak popularity.
This panel helps you understand which streams create read load. If the same channels appear on both the read issues map and the popularity map, disks are likely struggling because of heavy archive viewing on hot channels.
Use Cases:
- Plan load distribution: move popular archives to dedicated servers or faster disks
- Explain read error spikes during prime time: viewers are opening archives of popular programs in bulk
- Find "quiet" streams with a large archive but no views — candidates for migration or reduced retention depth
Deepest Archive Read Streams
The Top N DVR read depth by stream panel shows how far back into the archive viewers go for each channel.
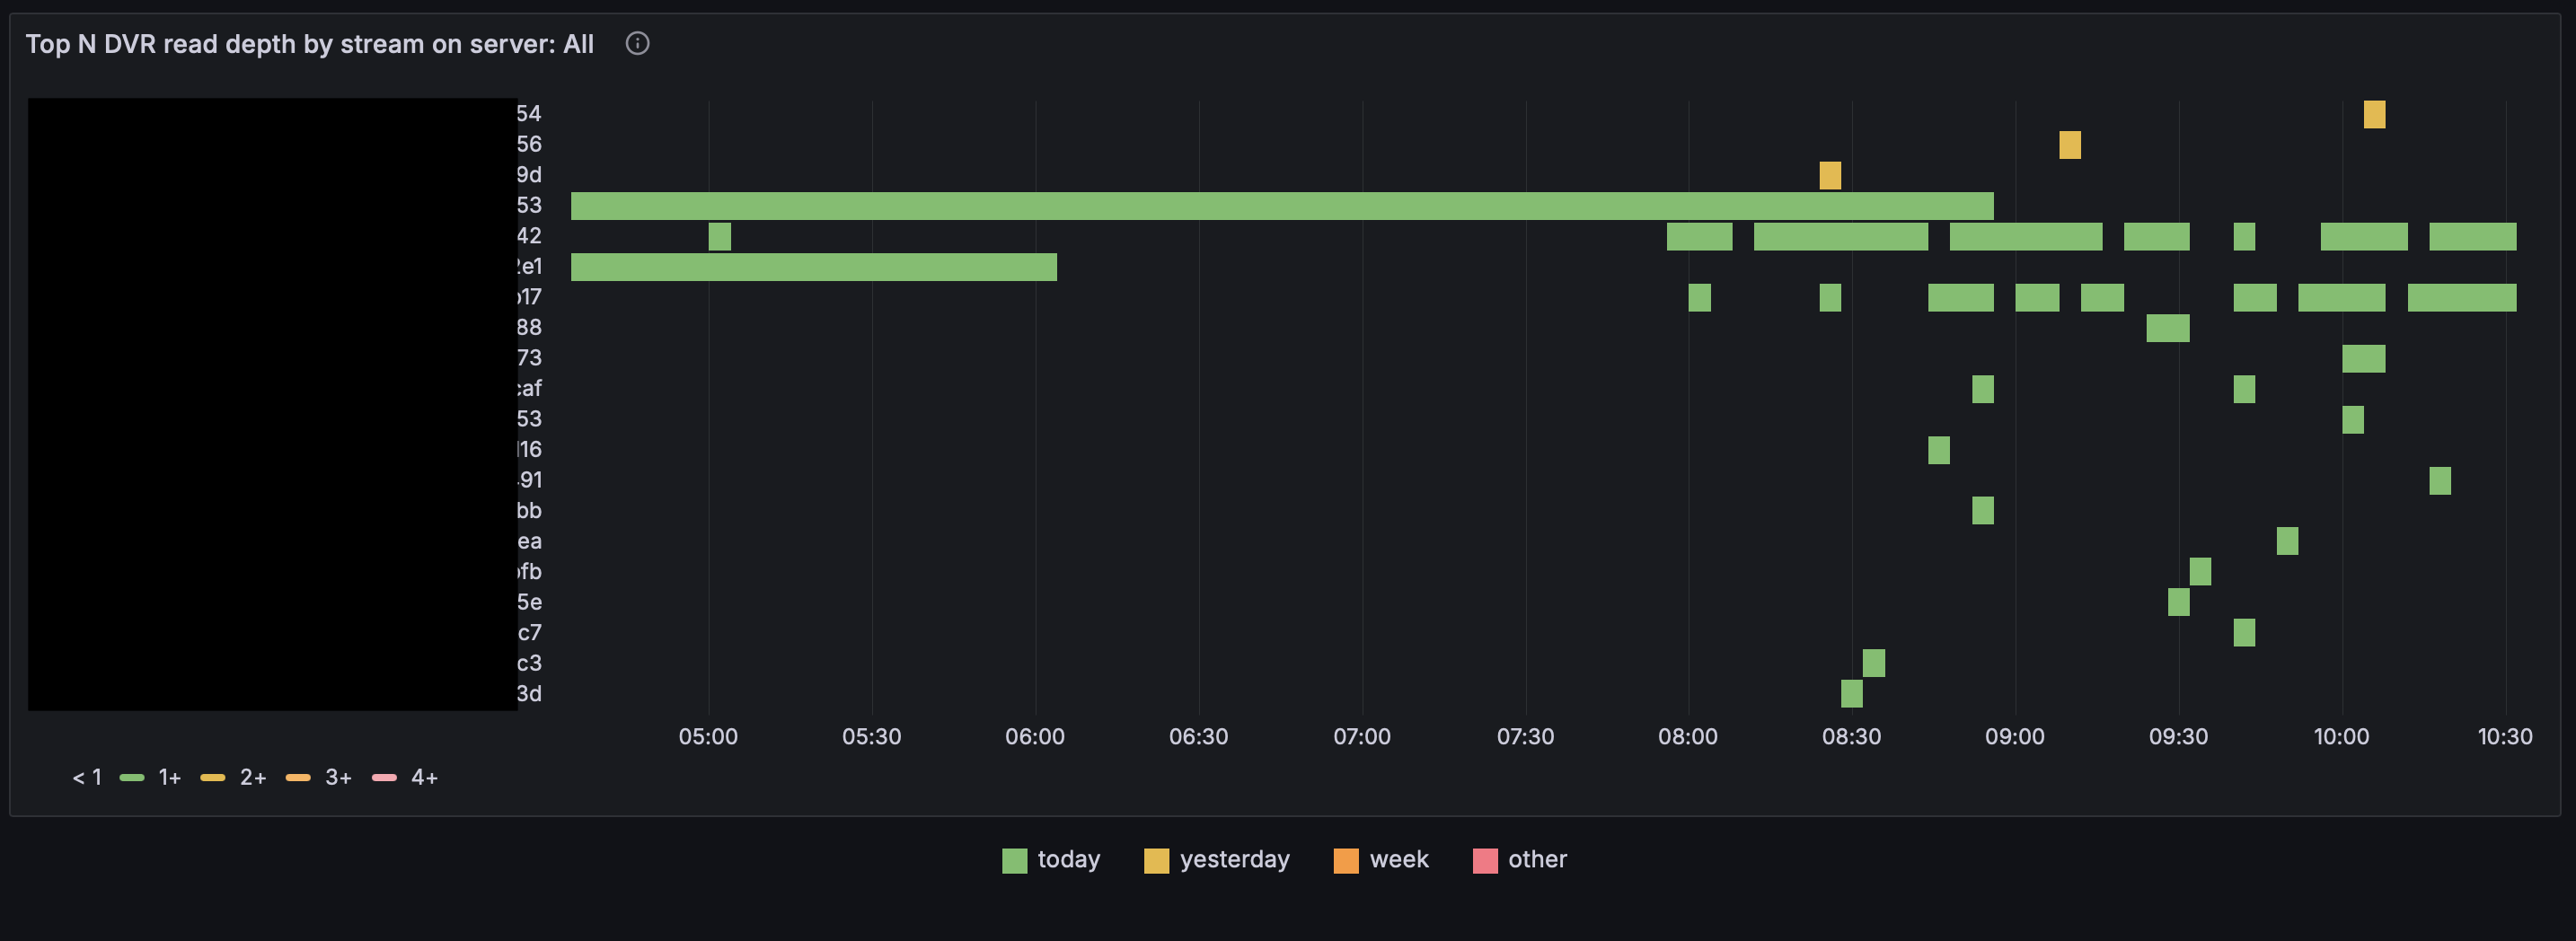
This is a heatmap: streams are listed vertically, time runs horizontally. Cell color reflects the age of viewed content — how far back viewers reach into the archive:
- today (green) — recordings from today;
- yesterday (yellow) — yesterday's archive;
- week (orange) — content from the last week;
- other (pink) — older than a week, deep archive access.
Unlike the Top N popular DVR read streams map, where color shows the number of simultaneous viewers, this map shows where in time viewers are watching. Channels with long orange and pink bands create load on old segments — disks and cache must serve data that is no longer in RAM.
Use Cases:
- Find channels where subscribers regularly watch week-old or older archive — plan retention depth and disk tier accordingly
- Explain slow read errors on channels that look quiet on the popularity map but show deep viewing here
- Identify streams where deep archive is never accessed — candidates for shorter retention without affecting subscribers
Server Overview: Input Status
The Input status block provides an aggregated view of the entire server: incoming traffic, archive recording, and archive reading.
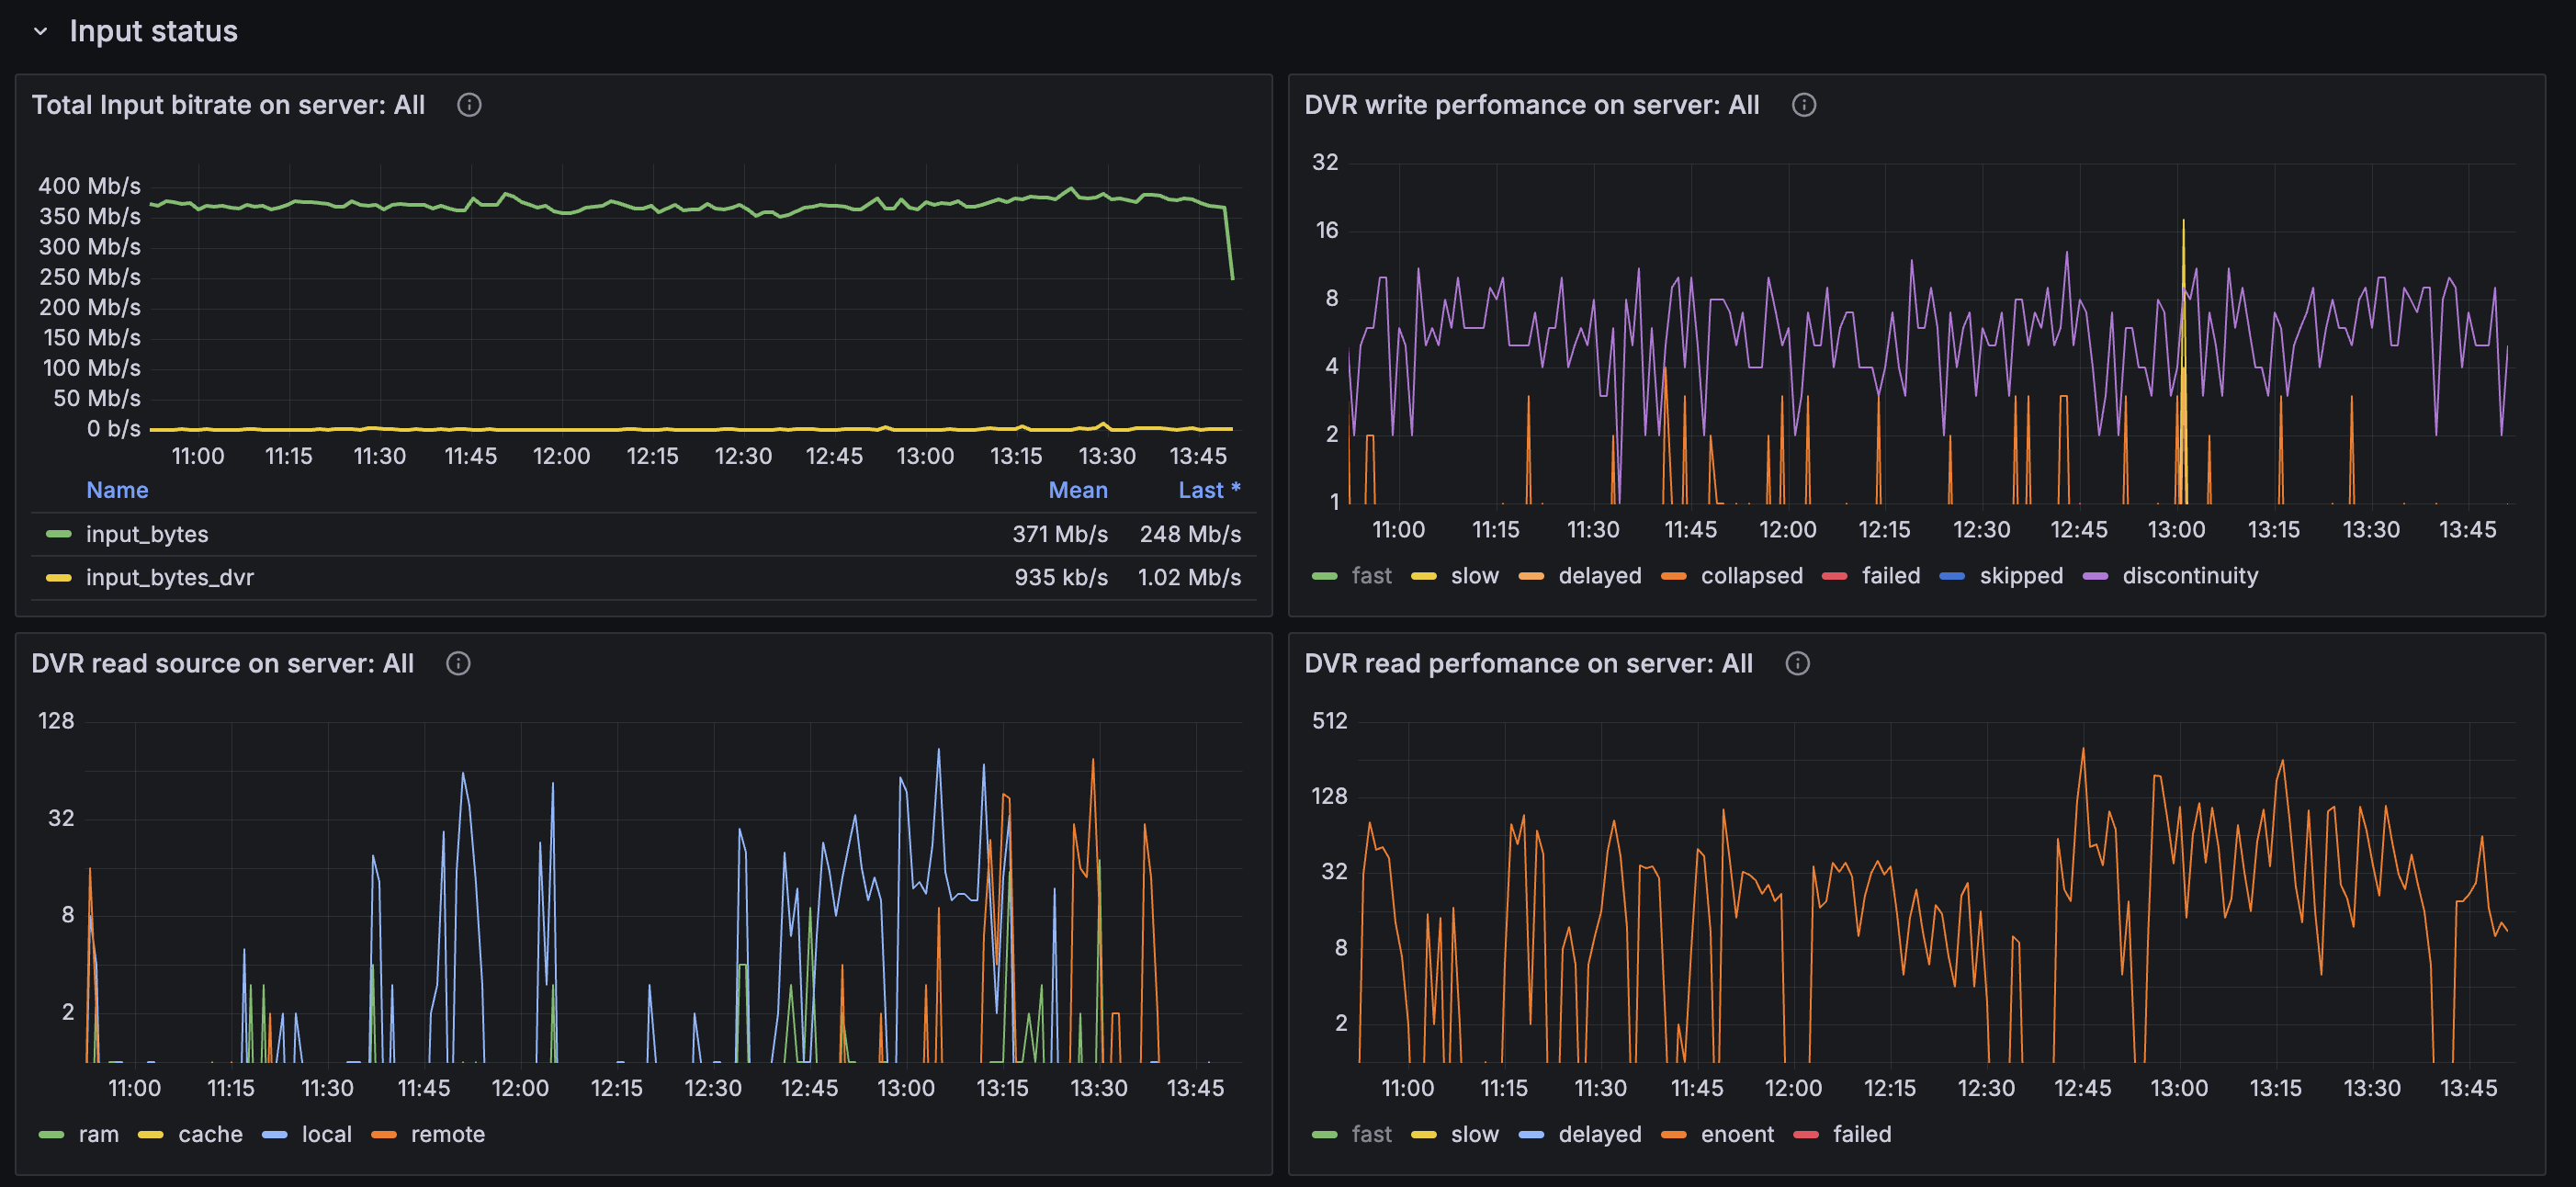
Total Incoming Bitrate
The Total Input bitrate graph shows total incoming traffic on the server:
- input_bytes — all incoming traffic, including live and archive recording;
- input_bytes_dvr — traffic related specifically to DVR (replication, pulling archive from other servers, etc.).
A sharp drop in input_bytes with a stable stream count is a sign of mass source disconnects. Growth in input_bytes_dvr without live growth may mean active replication or mass archive viewing from remote storage.
Server Write Performance
The DVR write performance on server graph is a summary across all streams:
- fast — normal fast recording, should dominate;
- slow, delayed, collapsed — growing degradation, storage cannot keep up;
- skipped, failed — data loss, urgent action required;
- discontinuity — gaps in the incoming stream, the archive will have missing parts.
The scale is logarithmic: even "small" spikes of collapsed or delayed on this graph should be taken seriously if they repeat.
Archive Read Sources
The DVR read source graph shows where the server reads segments during playback:
- ram — from RAM (fastest path);
- cache — from local on-disk cache;
- local — from local DVR storage;
- remote — from remote storage or another server.
Dominant remote with frequent enoent errors on the adjacent graph may point to network or replication issues between servers. Growth in local during peak hours is normal when archive viewing is active.
Server Read Performance
The DVR read performance on server graph summarizes read errors and delays:
- fast — normal;
- slow, delayed — storage is slow;
- enoent — segment not found;
- failed — I/O error.
If enoent dominates on the server rather than slow, the problem is more likely archive integrity (recording did not keep up, segments were skipped) than disk speed.
Archive Popularity by Content Age
The next two elements show which archive viewers are watching — recent or old.
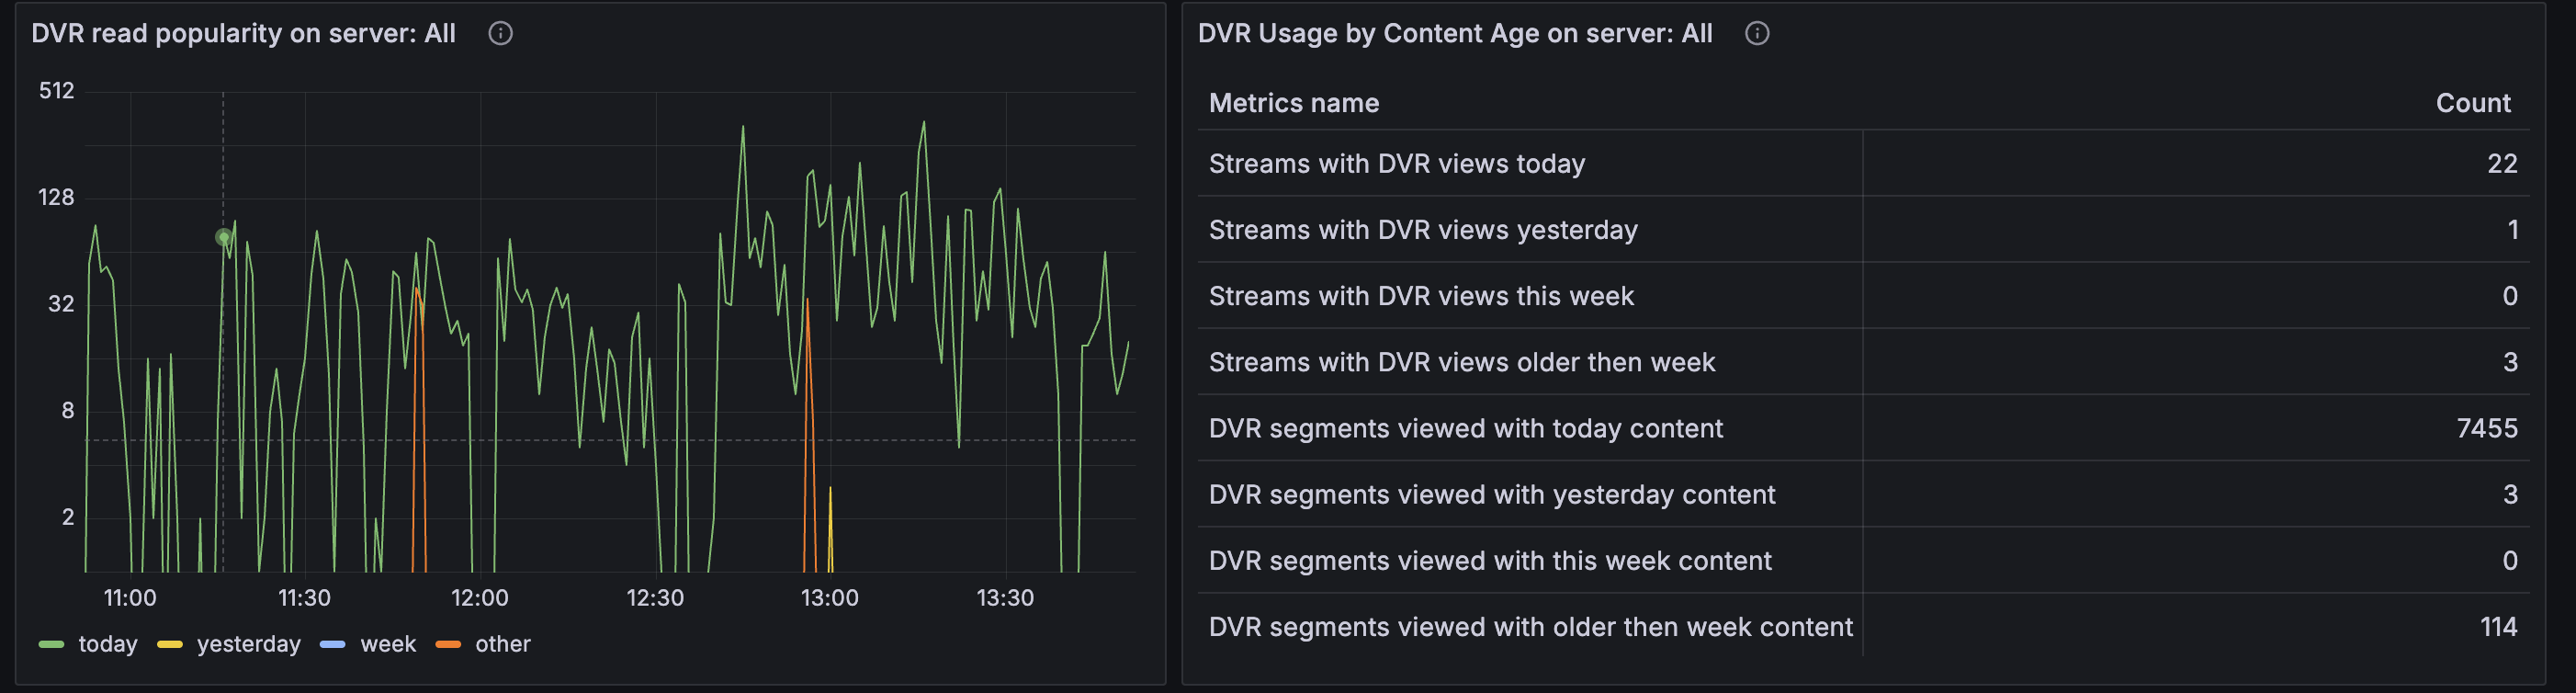
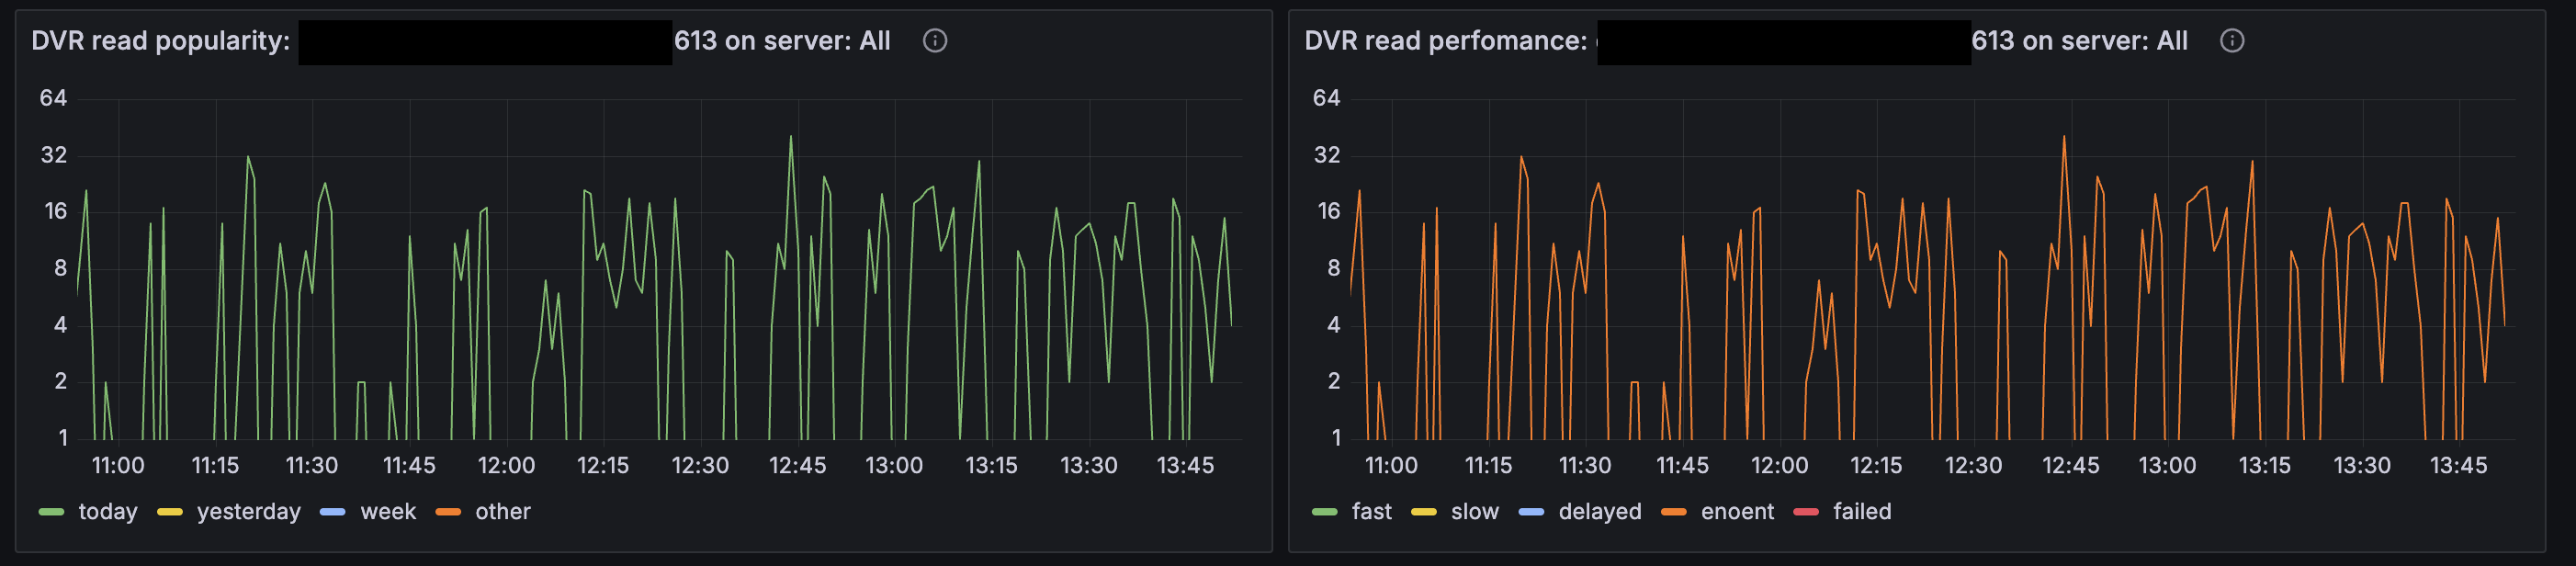
DVR Read Popularity Graph
Lines on the DVR read popularity on server graph are split by the age of viewed content:
- today — segments recorded today;
- yesterday — yesterday's archive;
- week — from the last week;
- other — older than a week.
In a typical service with a few days of archive depth, most load falls on today — viewers watch recent recordings, rewind live TV, open archives of current programs. A noticeable share of other means users are actively accessing deep archive; this increases read load and calls for faster disks or caching.
DVR Usage by Content Age Table
The DVR Usage by Content Age table presents the same data as numbers:
- how many streams were watched from the archive today, yesterday, this week, older than a week;
- how many archive segments were read in each category.
The table is useful for reports and before/after comparisons when changing infrastructure: for example, after moving popular channels to another server.
Most Viewed and Deepest DVR Channels Tables
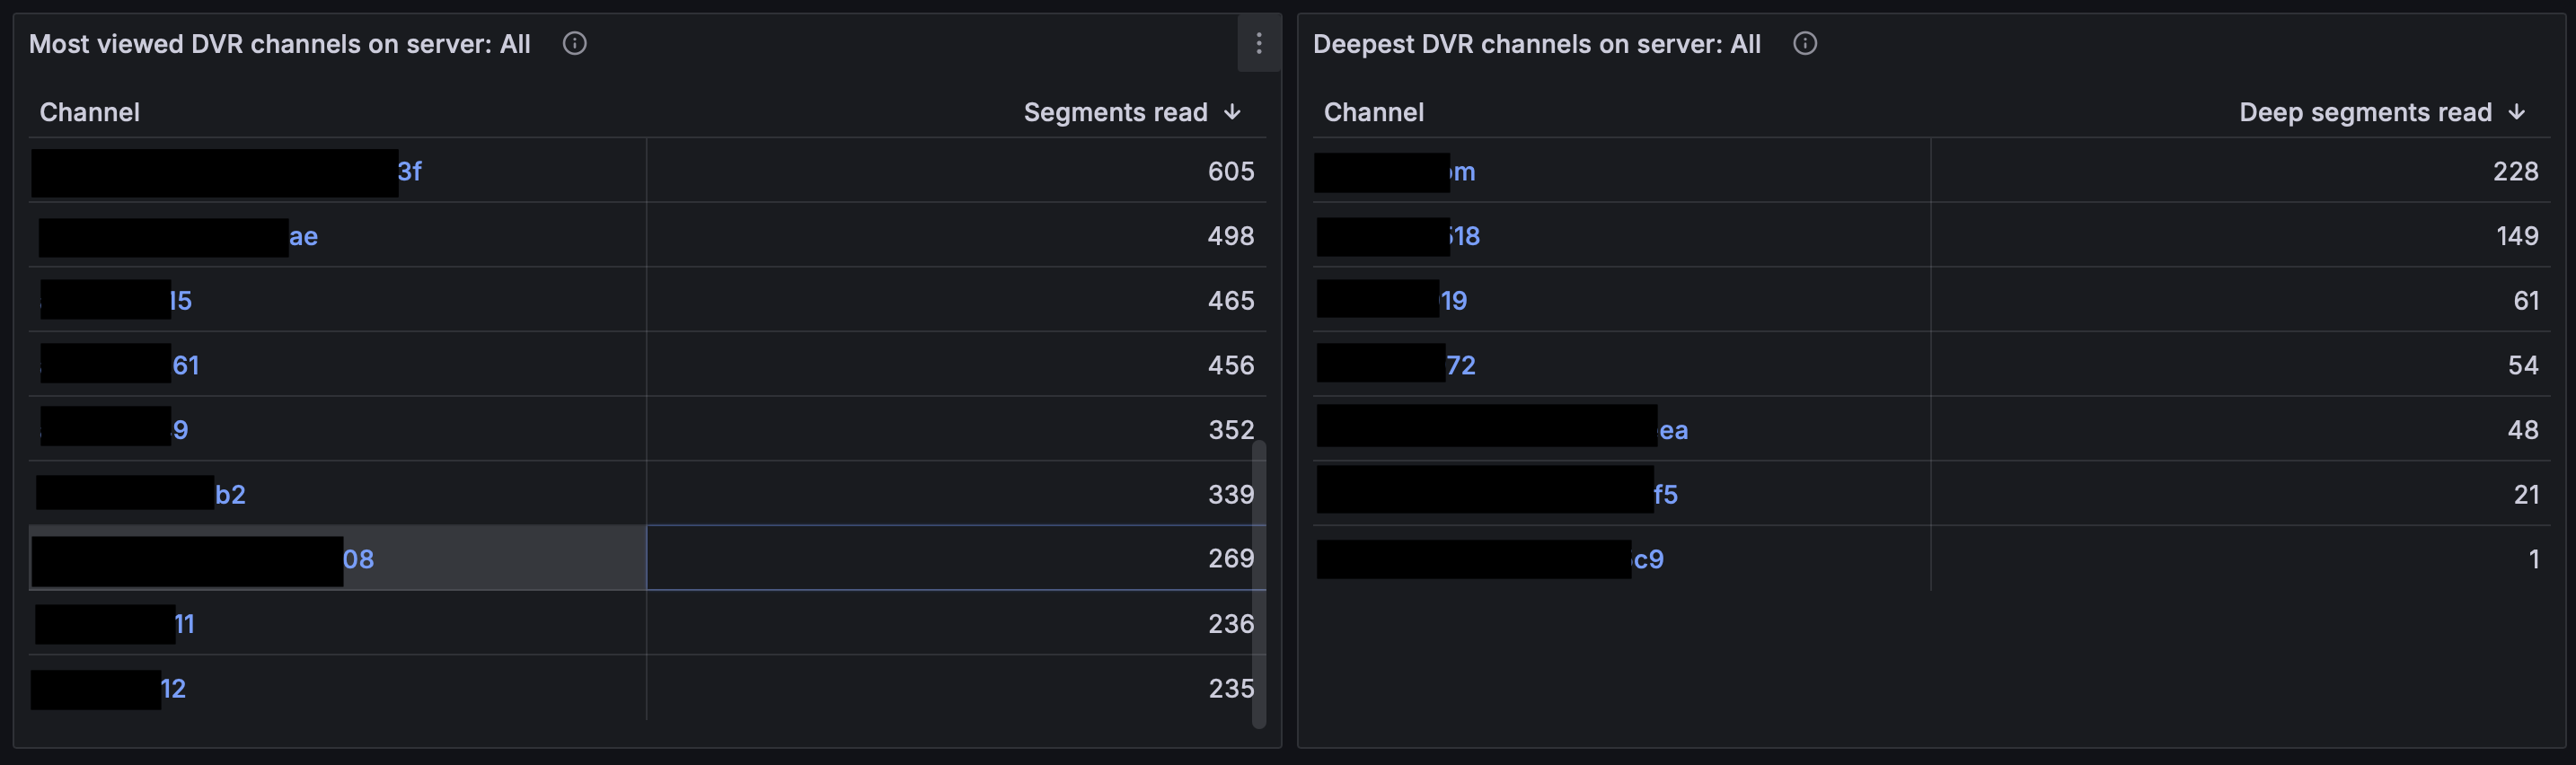
The Most viewed DVR channels and Deepest DVR channels tables rank channels for the selected period:
- how many archive segments were read per channel in total;
- how many archive segments were read per channel from deep archive.
The tables are useful for capacity planning: a channel can rank low on total views but high on deep segments if a few users regularly review old footage.
Stream Details: Recording
After selecting a specific stream at the top of the dashboard, the Stream details group shows panels for that channel.
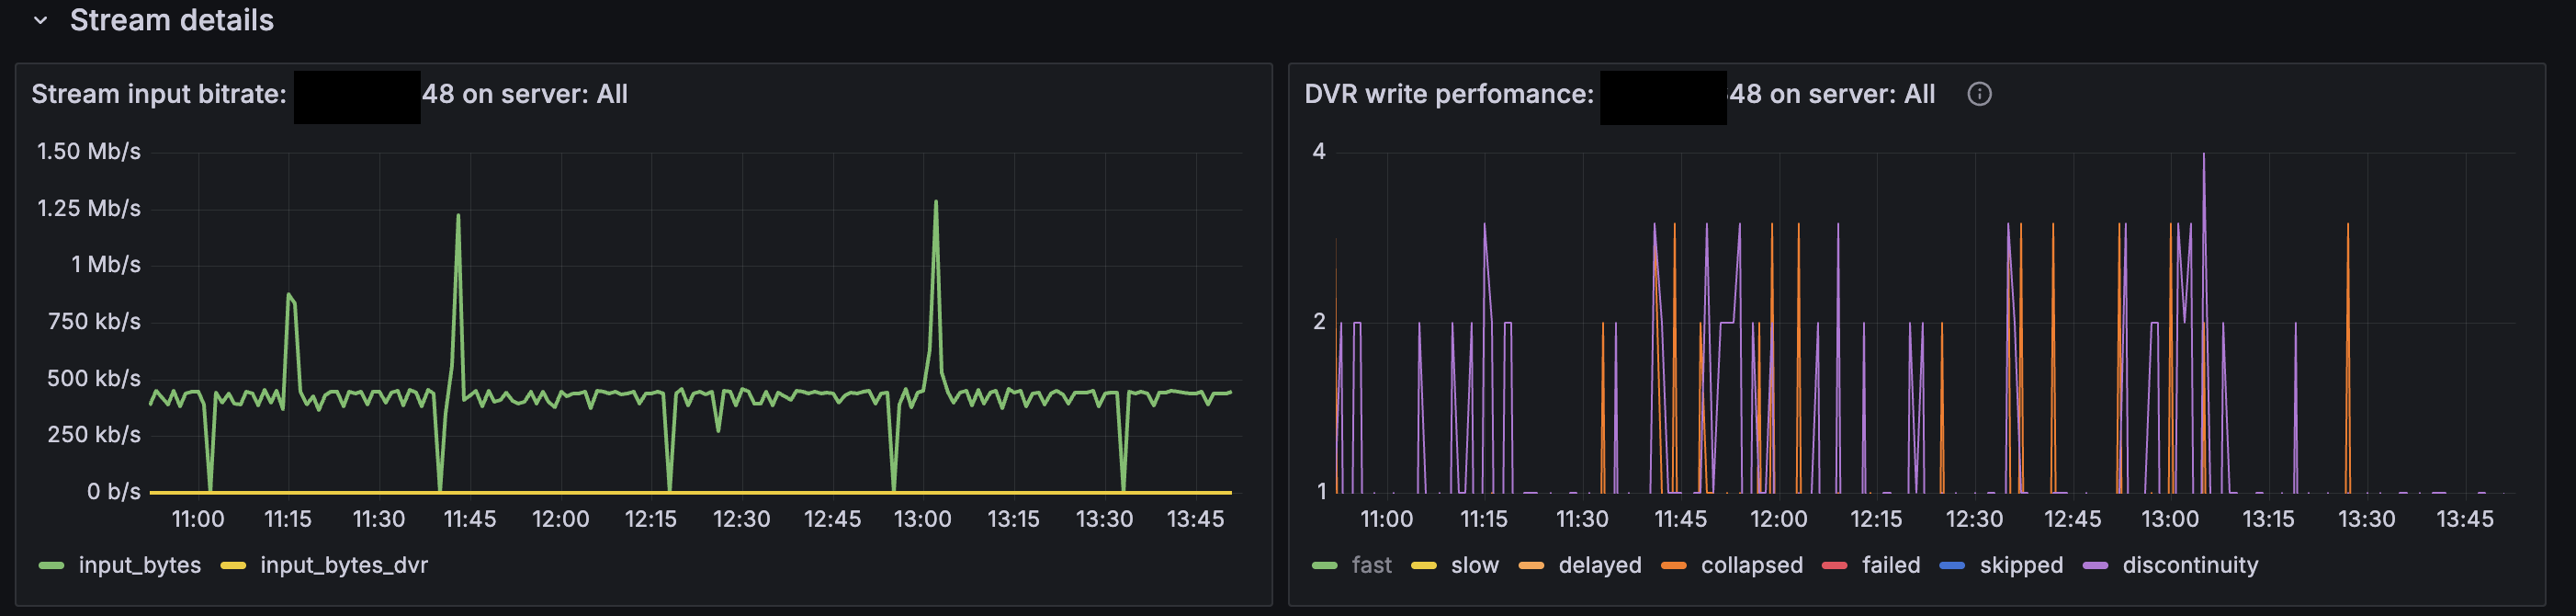
Stream Input Bitrate
The Stream input bitrate graph for the selected stream:
- input_bytes — current incoming bitrate;
- input_bytes_dvr — DVR-related traffic for this stream (for example, receiving replicated archive).
Drops in input_bytes to zero with non-zero discontinuity errors on the adjacent graph confirm that archive gaps are caused by source disconnects, not the disk. Stable input_bytes with rising collapsed and delayed points to a storage-side problem.
Stream Write Performance
The DVR write performance graph for the selected stream shows the same metrics as the server summary graph, but for a single channel.
This is where you drill into a specific case from the dvr write issues heatmap: which error types dominate and when they occur.
- Frequent discontinuity without failed — fix the source or network to the camera
- Rising collapsed and delayed with stable input — relieve disk load, change storage
- Appearance of skipped or failed — urgent, archive is already being lost
Stream Details: Archive Reading
Archive read panels are available for the selected stream.
Read Source
The DVR read source graph shows where this channel's archive is read from, split by source (ram, cache, local, remote).
- ram — segments read directly from RAM
- cache — segments read from cache
- local — segments read from local DVR storage
- remote — segments read from remote DVR storage
Read Performance
The DVR read performance graph (the UI may show it as "DVR read perfomance") shows archive delivery quality:
- fast — normal read;
- slow, delayed — storage is slow;
- enoent — requested segment is missing;
- failed — disk read error.
If enoent dominates during active viewing (green today line on the adjacent graph), viewers are trying to open archive that physically does not exist — check the write graph for the same stream: recording likely did not keep up or segments were skipped. If slow and delayed dominate with zero enoent, disks cannot handle read load, but the data is there.
Read Popularity
The DVR read popularity graph shows how intensively this channel's archive is viewed, split by content age (today, yesterday, week, other).
- today — segments read from today;
- yesterday — segments read from yesterday;
- week — segments read from the last week;
- other — segments read from more than a week ago.
Compare it with the dvr read streams map: if the stream is in the popularity top and simultaneously in the read errors top, viewing load is likely overloading storage on this channel.
Use Cases:
- Complaint about a specific channel: select the stream, correlate popularity and read errors over time
- After a disk incident: confirm enoent has dropped to zero — the archive is intact again
- Before moving a channel to another server: assess actual read load from the popularity graph