Server Stats Dashboard
The Server Stats dashboard provides high-level monitoring of server load metrics across your entire streaming infrastructure.
Its overview section is similar to standard server monitoring tools, but the important thing is that it's already included in the service and you don't need to monitor additional agents.
Most Overloaded Servers
This panel displays servers with the highest resource utilization across key measured parameters.
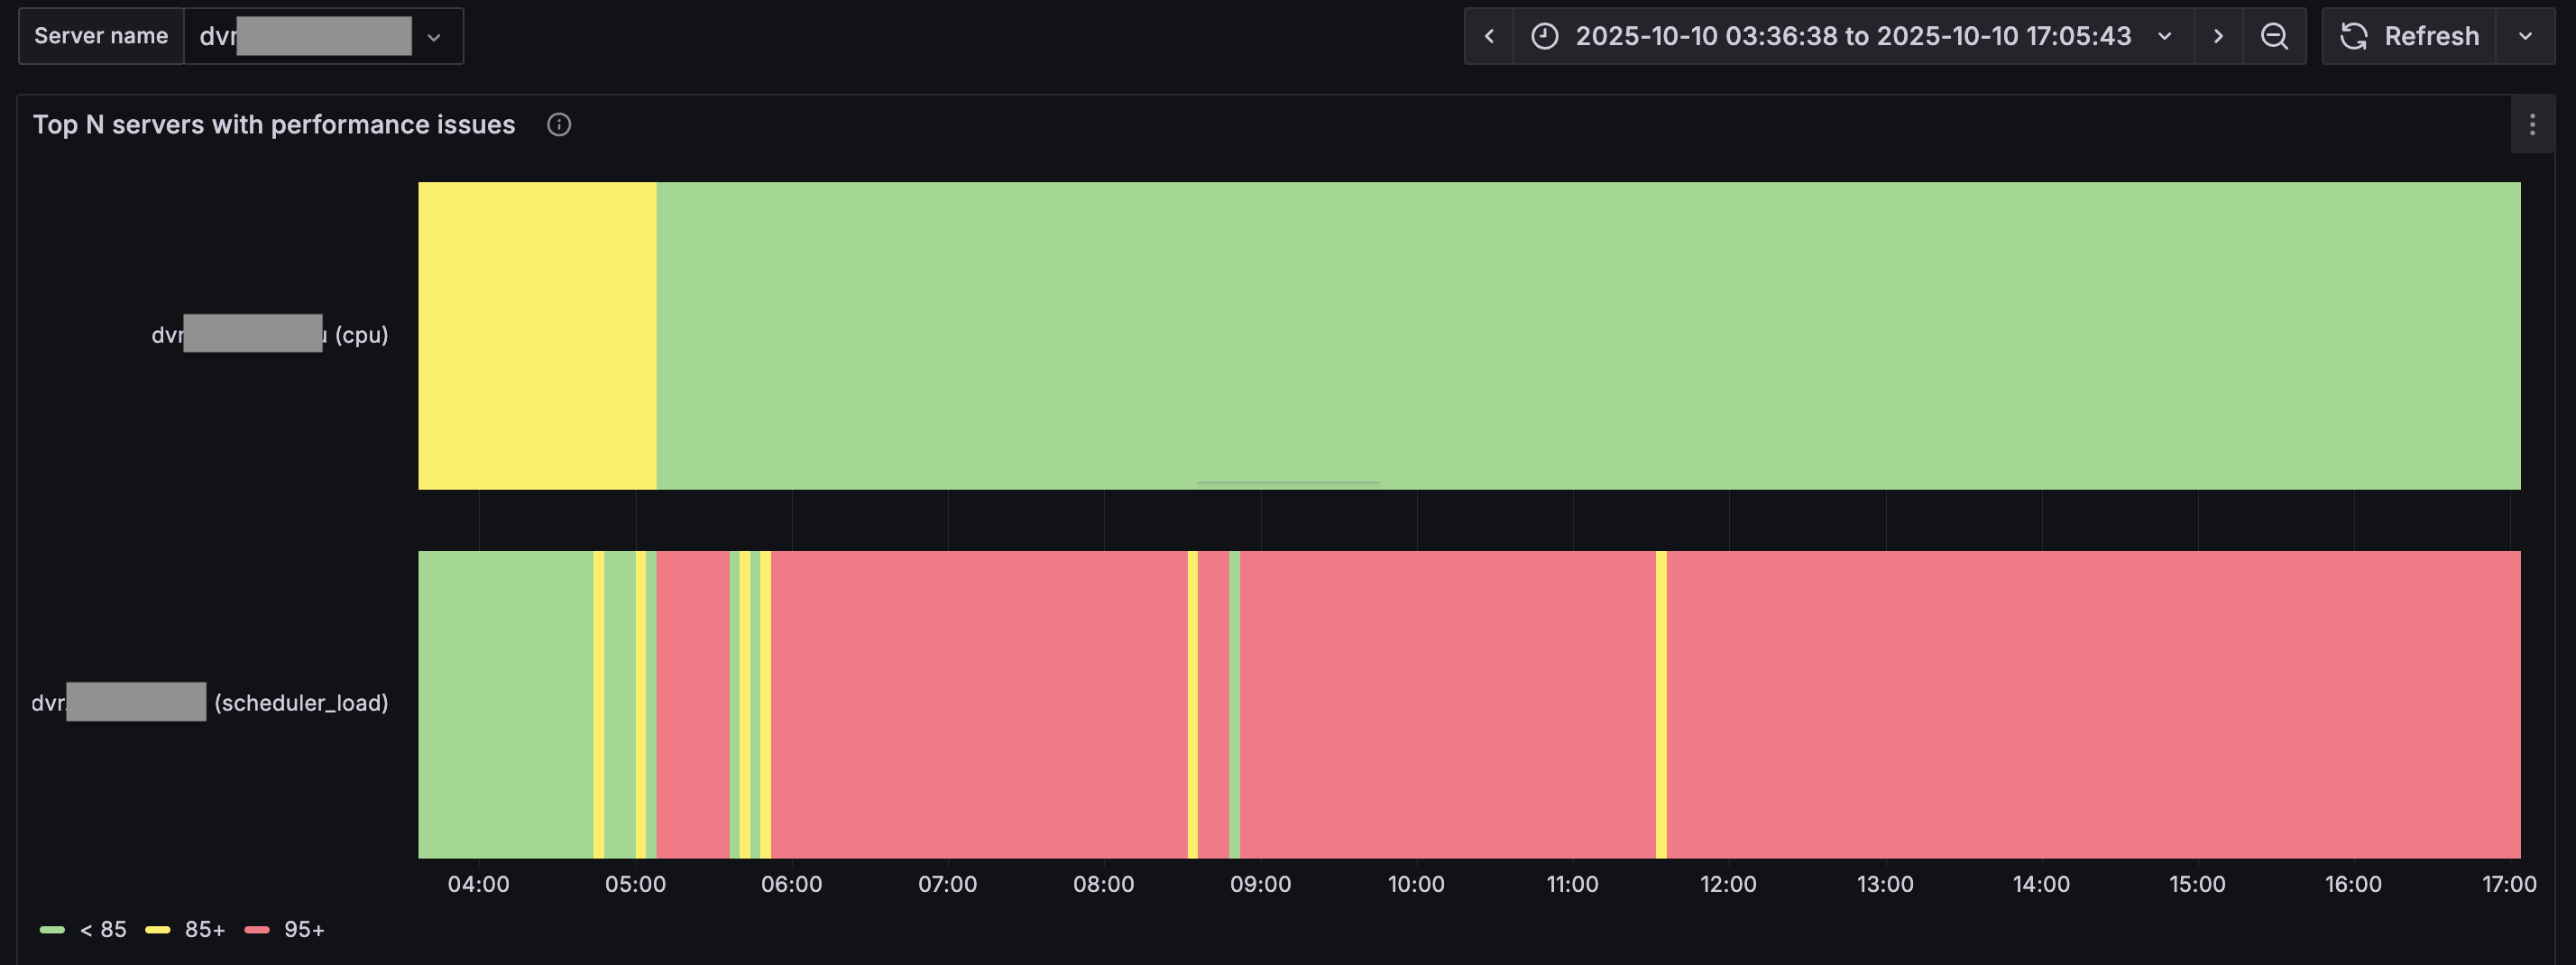
Displayed Information:
- Servers with maximum load on at least one parameter are raised to the top
- Load distribution over time. It's recommended to change the time range - narrowing it down to hours and minutes may bring servers with recent issues to the top
Use Cases:
- Select the last 2-3 hours in the dashboard, see servers with red indicators, proceed to resolve the issue
- Select the last 7 days in the dashboard, see periodic load spikes up to red levels. Identify the source of periodic growth and if it shouldn't exist, resolve the issue
- Select the last 30 days in the dashboard, see steady load growth, start planning infrastructure expansion
Overloaded Service Example
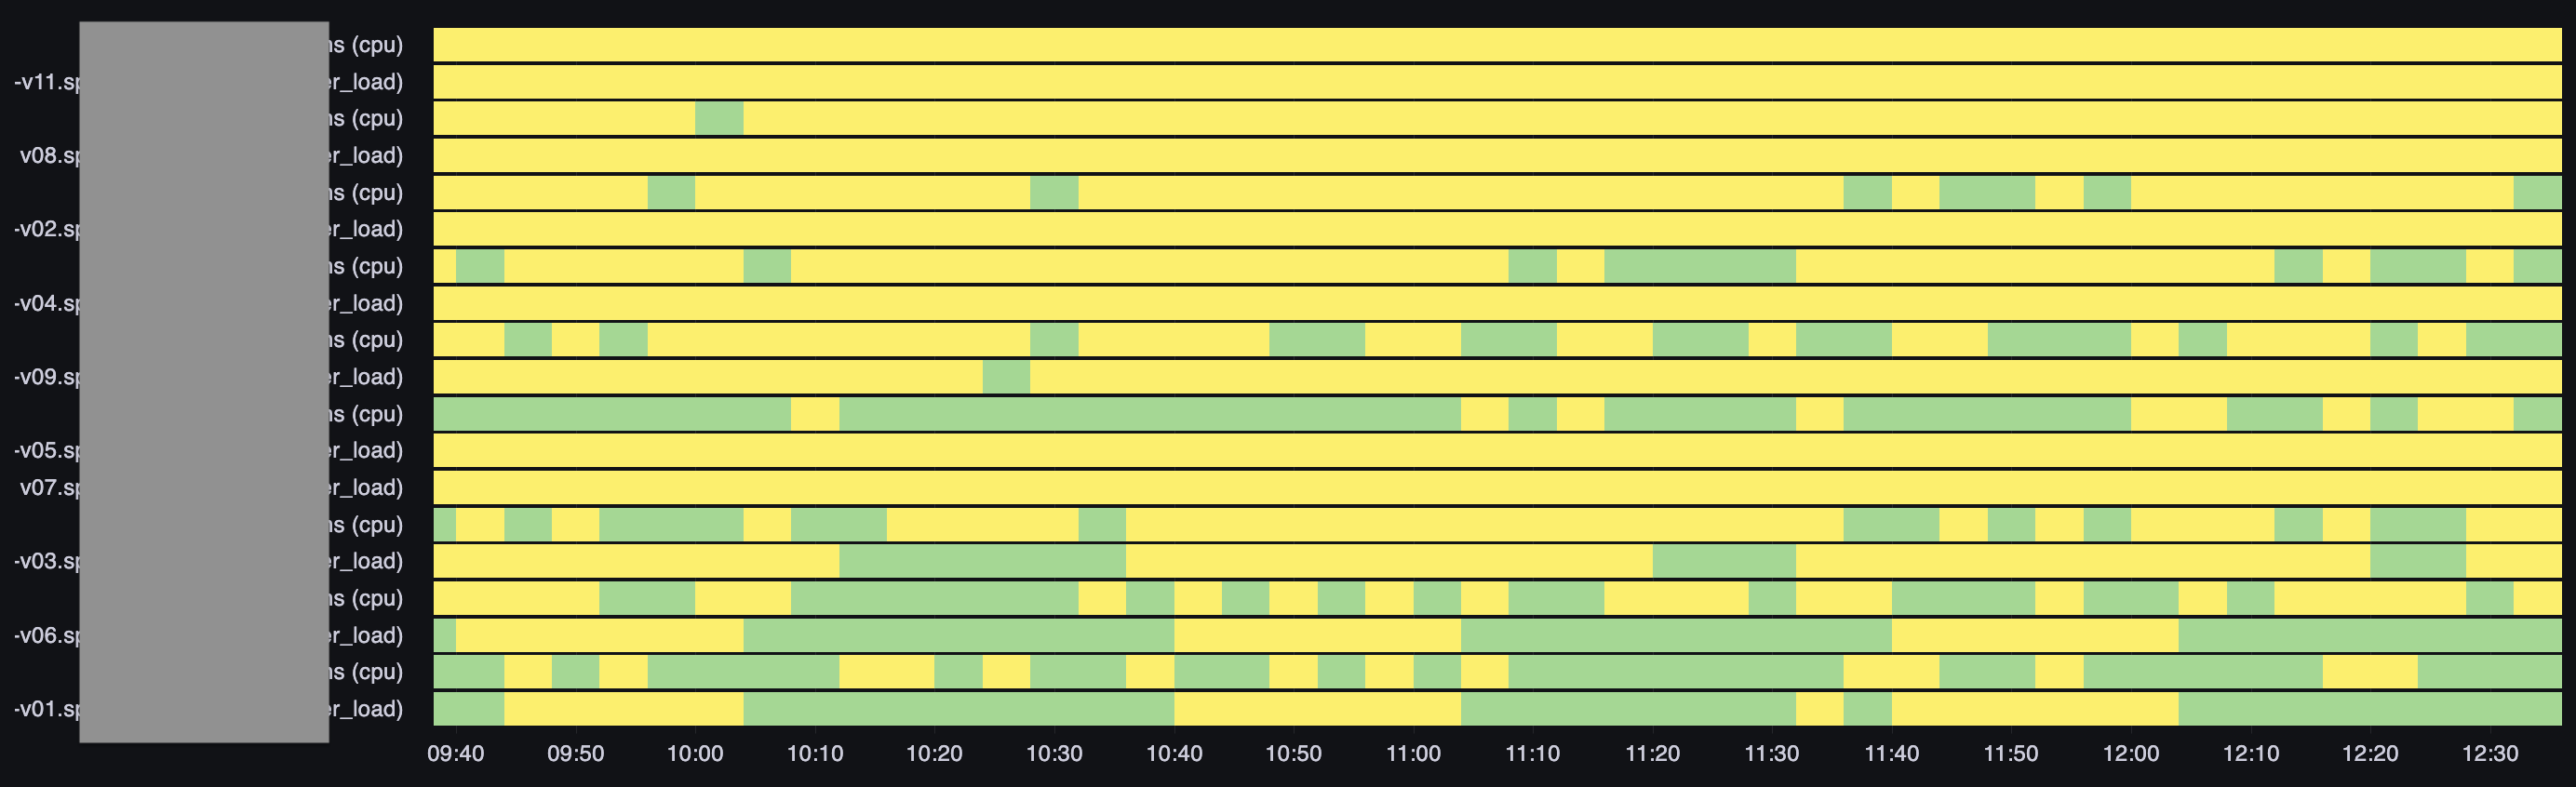
On this service, the CPU and load situation is all in the yellow zone. This can be considered efficient server utilization because there are no signs of plateauing on the CPU graph, however these servers cannot handle any additional load.
Set up alerts: To avoid missing critical server load, configure CPU load alerts and scheduler load alerts. They will warn you before the server stops handling the load.
CPU and Virtual Machine Load
The following two panels provide an overview of central processor and virtual machine load. These are different metrics - you cannot rely on just one.
A common mistake by system administrators is making decisions without knowledge of virtual machine operation and complaining about CPU growth without considering the scheduler.
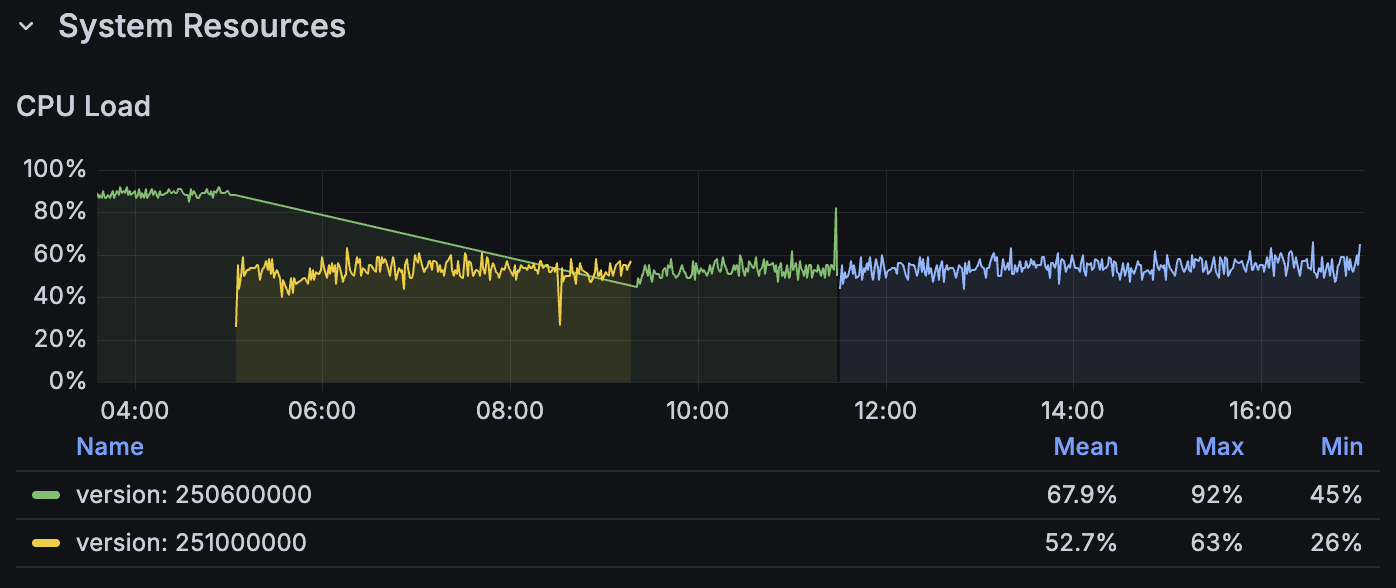
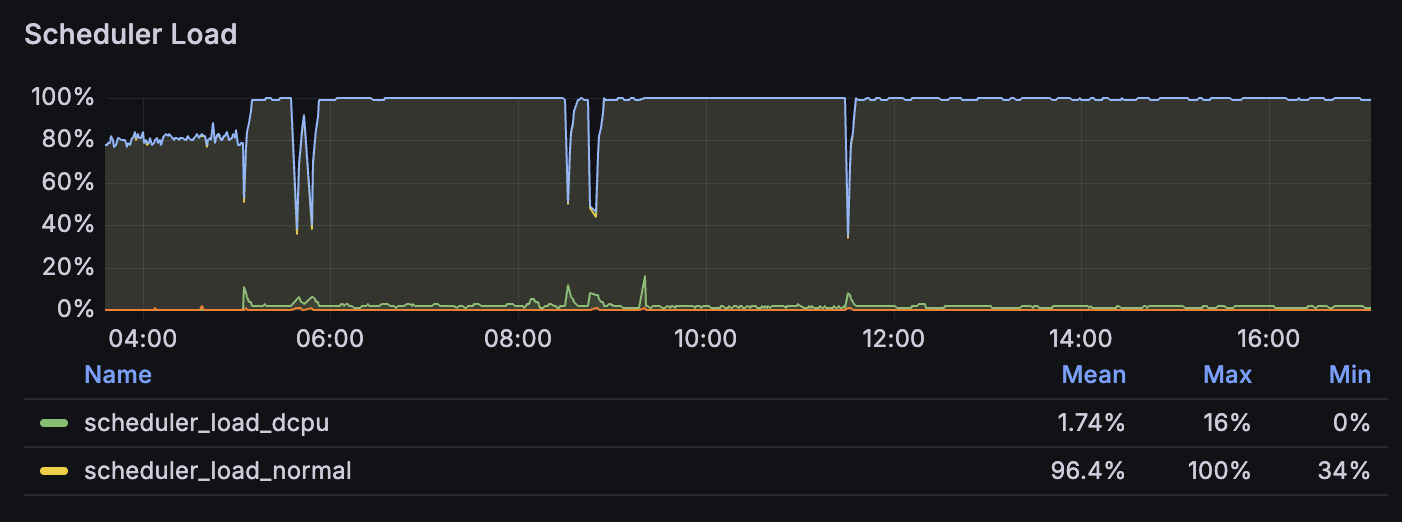
80% CPU load is not critical, although elevated. The streaming server's operability must be assessed by scheduler load, which is a more reliable metric. Virtual machine operation may involve high CPU load, and in special cases, 100% full load of several CPU cores is normal.
Important: you cannot extrapolate CPU load by adding several streams and expect linear growth. The internal mechanisms that allow scaling a streaming server to thousands of simultaneous streams have certain costs, so growth will be non-linear.
On this graph and further graphs are divided by versions. Very convenient to track: whether there was actual performance degradation or just an illusion.
Critical Load Example
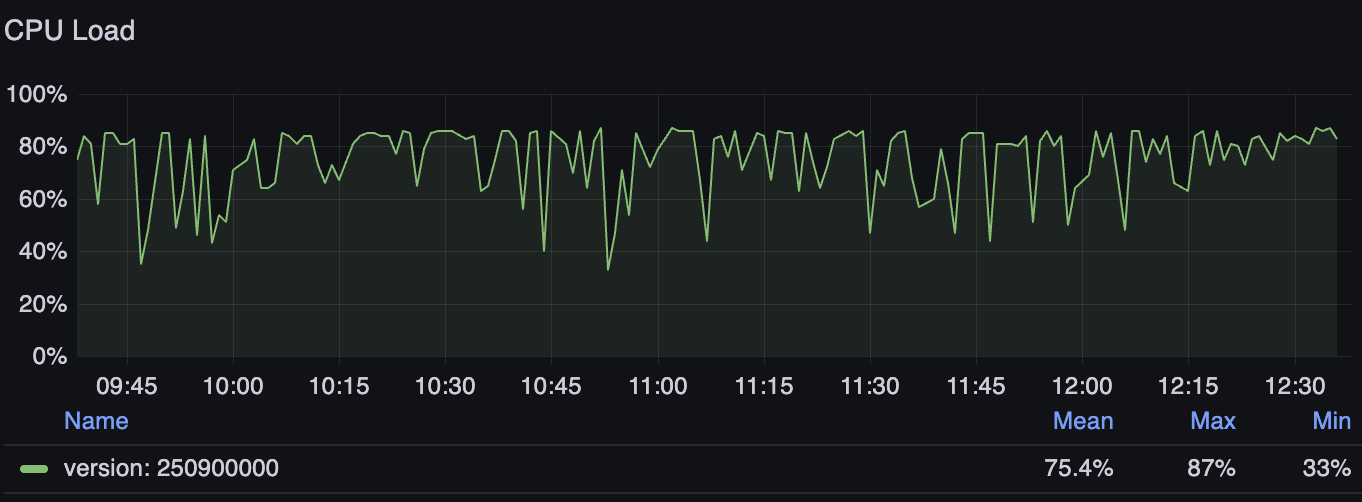
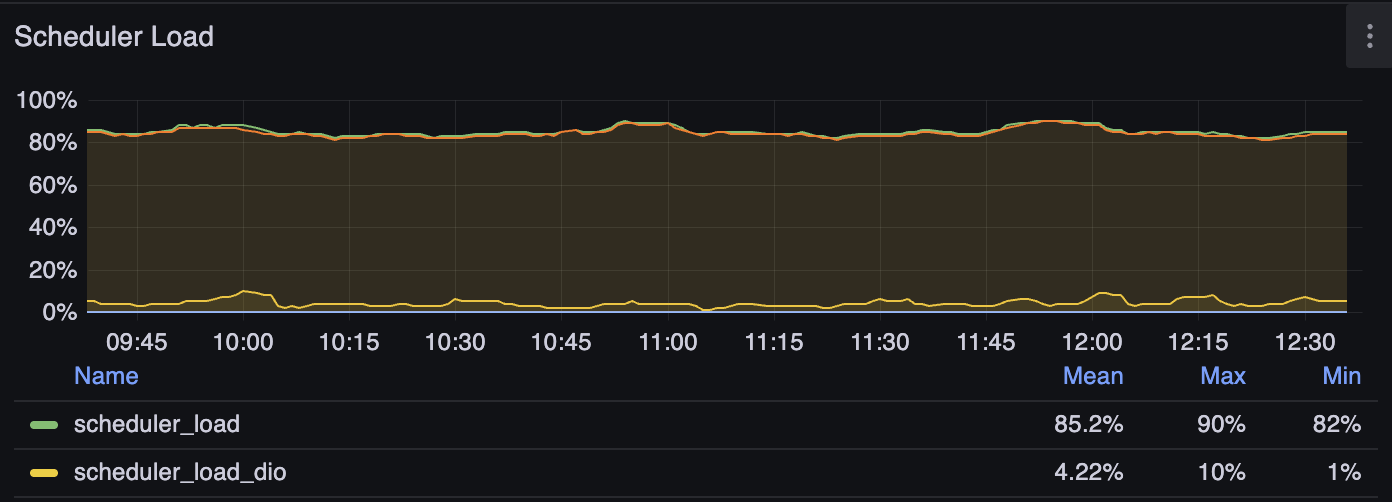
On these two graphs, you can see that CPU is at the limit (this service was mentioned above) and possibly hitting a plateau, i.e., not coping, but the scheduler graph shows there's no plateau - the server is just at the limit. However, you'll see later that its disks are not coping.
Set up alerts: To avoid missing critical server load, configure CPU load alerts and scheduler load alerts. They will warn you before the server stops handling the load.
Memory Utilization
RAM usage monitoring on servers.
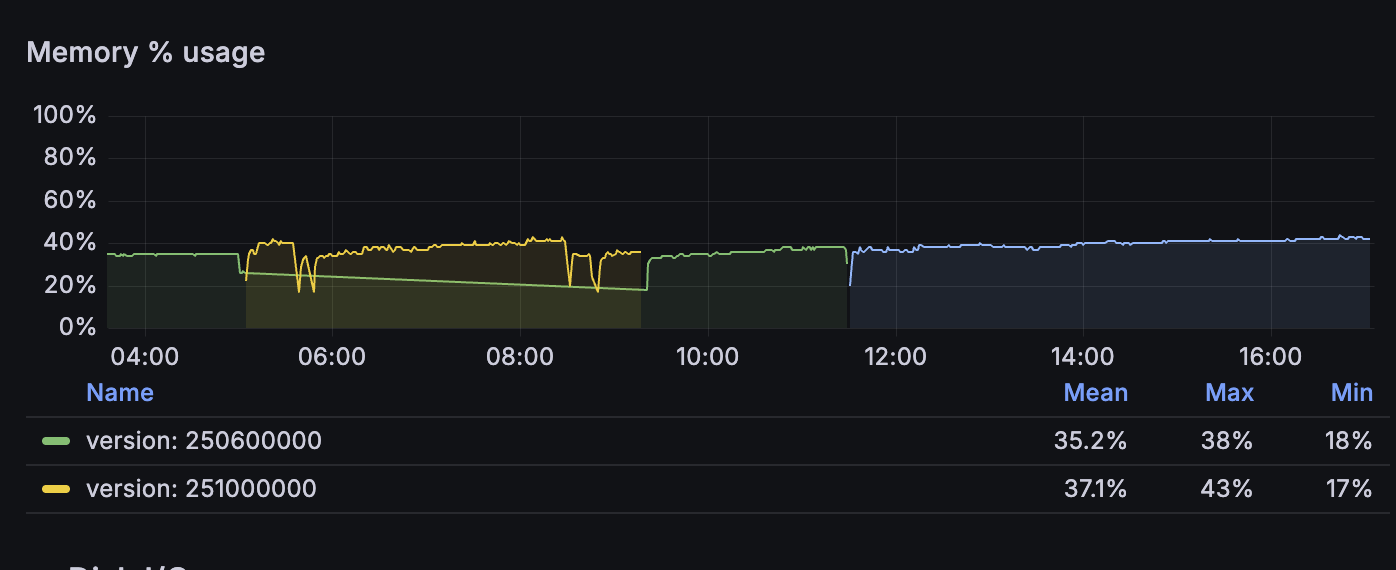
Shows total memory usage - this is the graph to focus on.
Normal state is stable.
The graph doesn't show swap usage for one simple reason: on a streaming server, swap should be disabled. It's not needed in any scenario, and it can lead to the system going into failure instead of emergency shutdown, resulting in dozens of minutes of downtime instead of a few minutes.
Set up alert: Configure a low memory alert to get notifications when approaching RAM limits and take timely action.
Disk Write Errors
Tracking disk write errors.
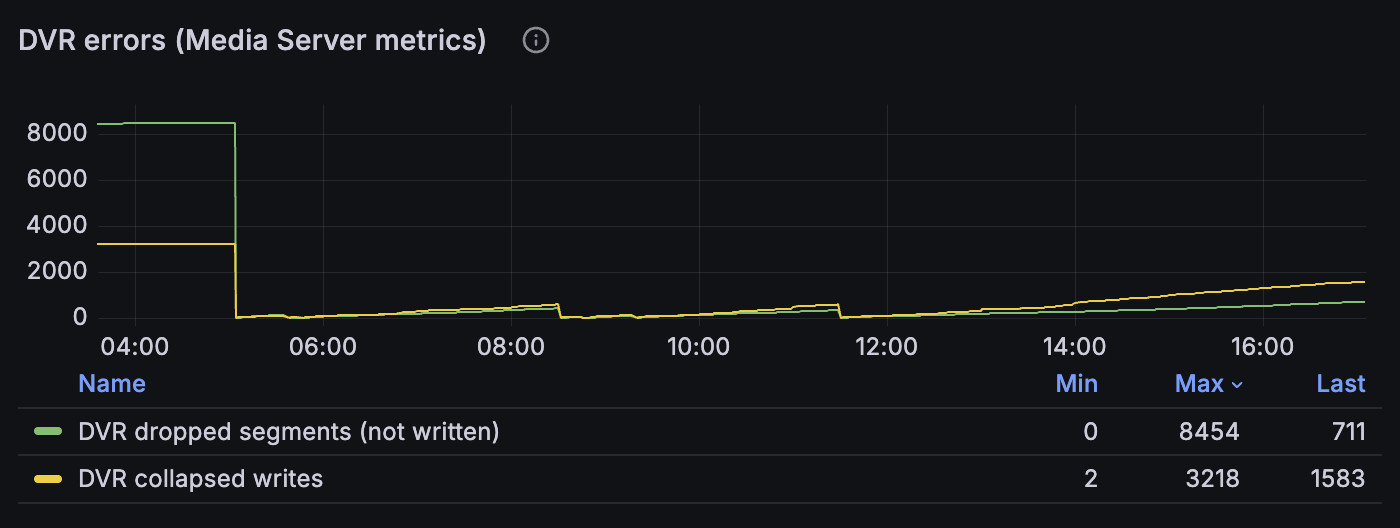
Displayed Metrics:
- Collapsed writes to disk
- Failed write attempts
When storage begins to lag in writing (this is normal behavior for network storage, which very often cannot deliver constantly stable and predictable write speeds for weeks), the media server first starts grouping adjacent writes. Each such grouping is reflected in the Collapsed writes graph and represents an alarming situation. This shouldn't happen, but it's not a problem yet.
Typically, after prolonged ignoring of collapsed writes, you can observe write failures: failed writes. The media server cannot keep segments in the write queue forever - it stores them only as long as they are available for live viewing, so when the playback window passes and the write hasn't occurred, the video is lost irretrievably.
This is already a serious service failure.
Use Cases:
- Detect failing storage hardware
- Identify filesystem issues
- Plan disk replacement
- Monitor storage reliability
Set up alert: Disk issues alert is critical for servers with DVR. It will warn you when collapsed writes appear before failed writes begin with video loss.
Disk Utilization
Monitoring disk operation speed allows you to see potential problems on individual disks.
This section makes sense to visit if there are indications of disk write or read errors. Otherwise, this section is informational in nature - check once a month that there are no anomalies.
Disk I/O Percentage
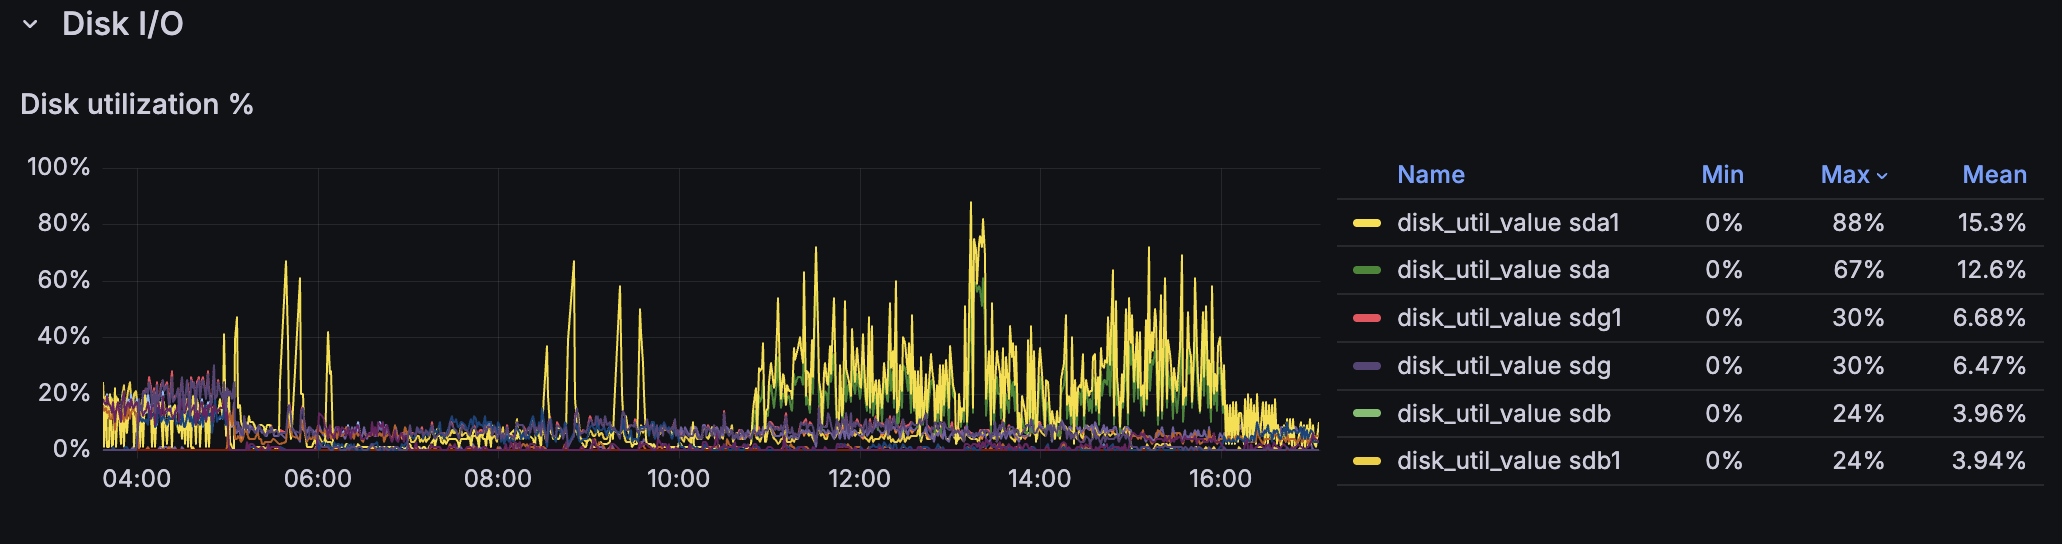
Normally should be no more than 80%. Individual spikes are acceptable, nothing critical if they don't lead to service operation errors.
Disk Fill Level
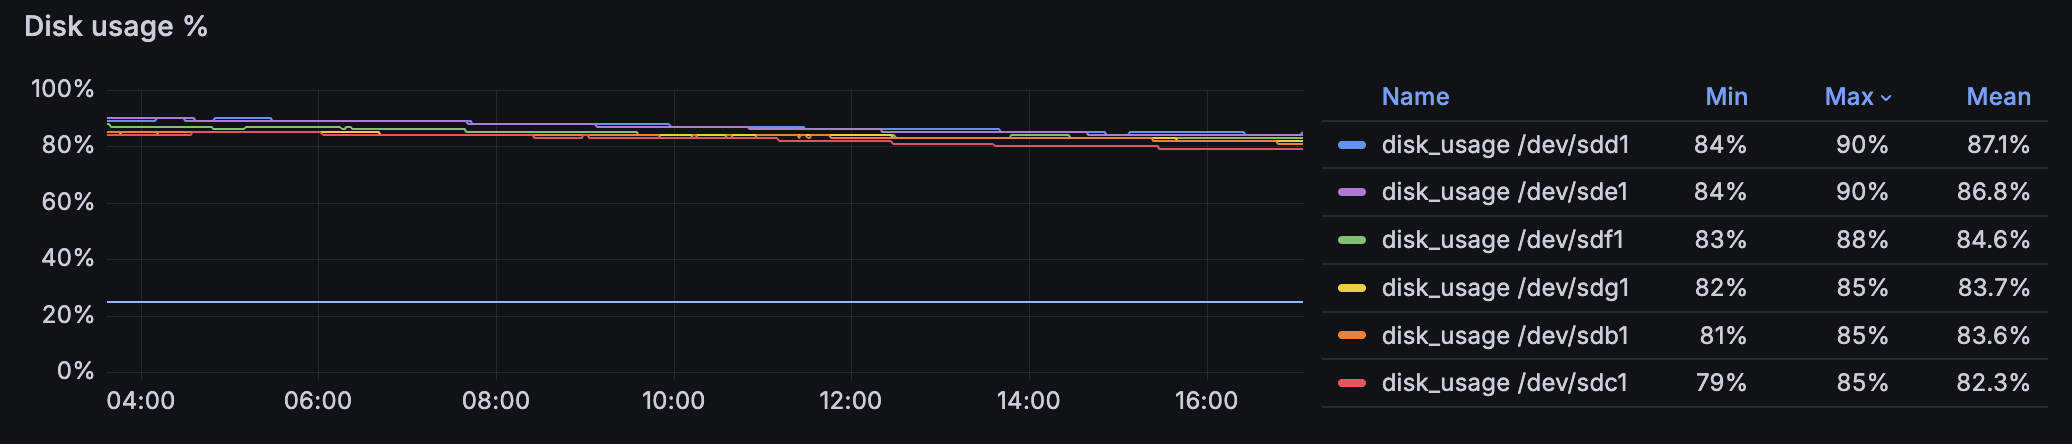
Should be stable around the limit. 98% is normal if your storage uses ext4. If you decided to use btrfs, service failure is possible at 55%, but we won't be able to help you.
Disk Write Speed
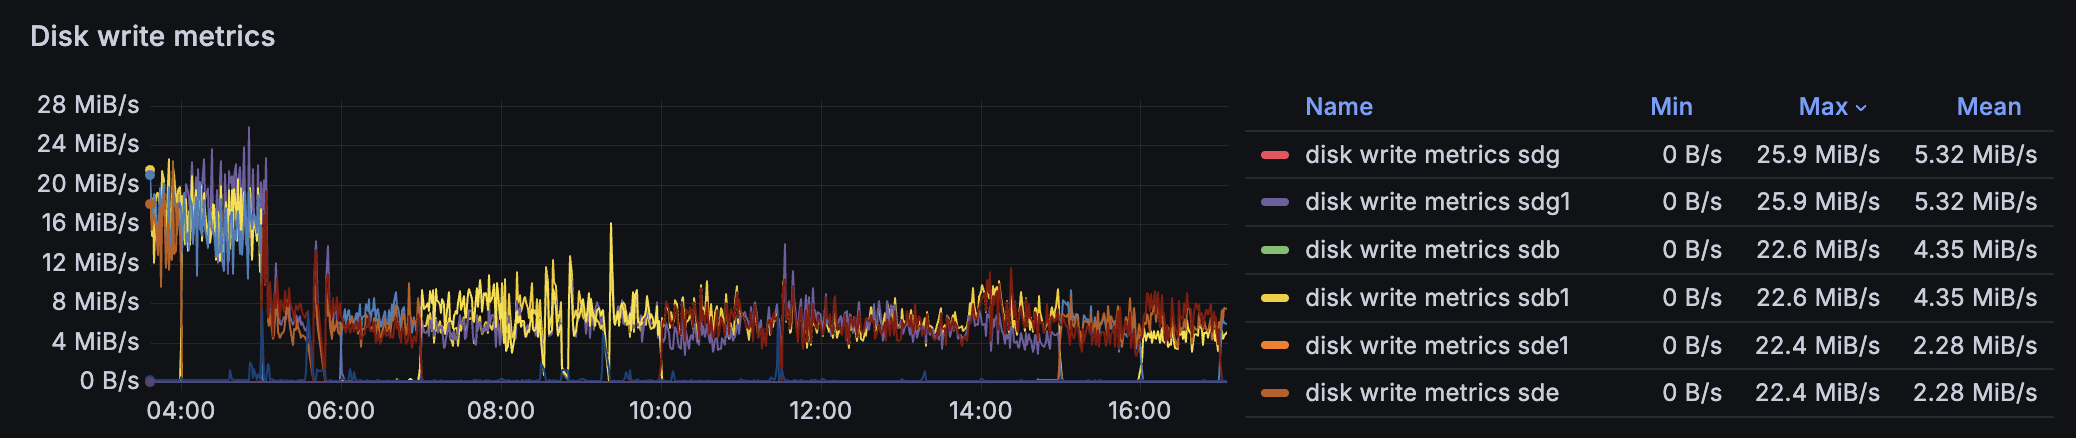
There's no single norm - it differs by orders of magnitude for spinning disks and NVMe. Sharp jumps or plateaus are of interest.
Disk Read Speed
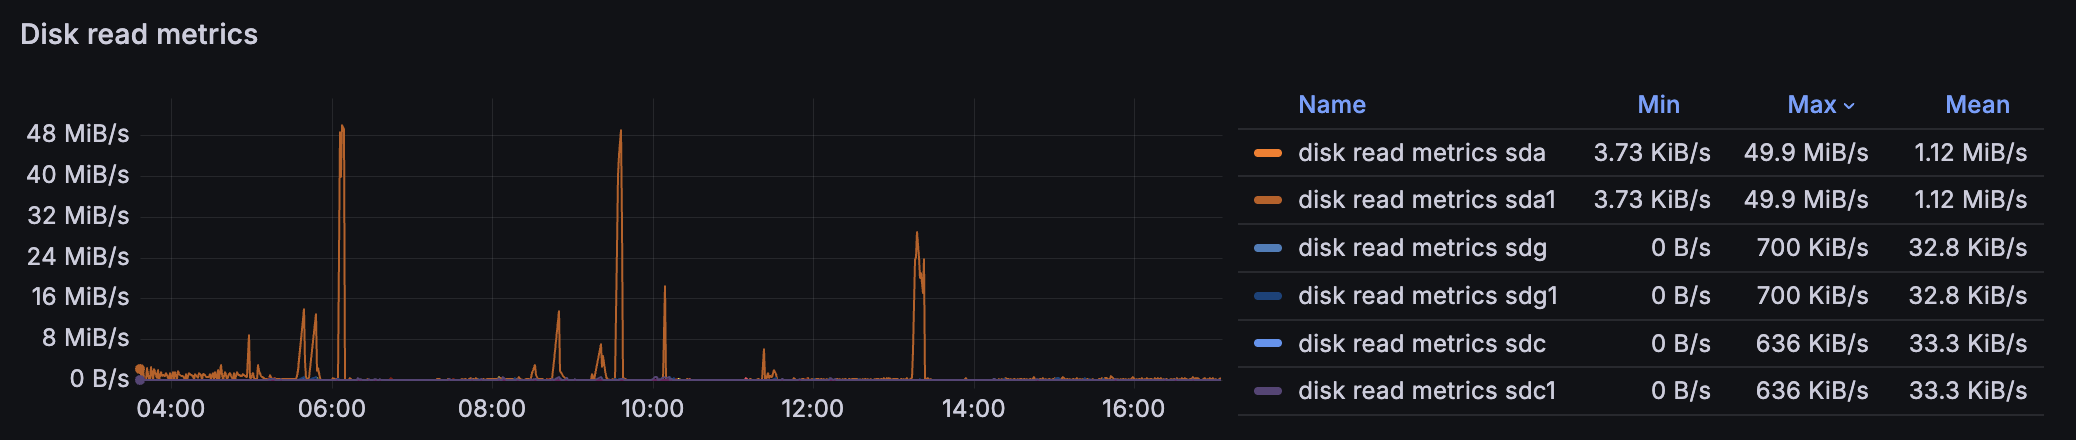
Similar to the previous: there's no single norm. Pay attention to sharp changes, as well as trends over months.
DVR RAID disk status (only for servers with DVR RAID enabled)
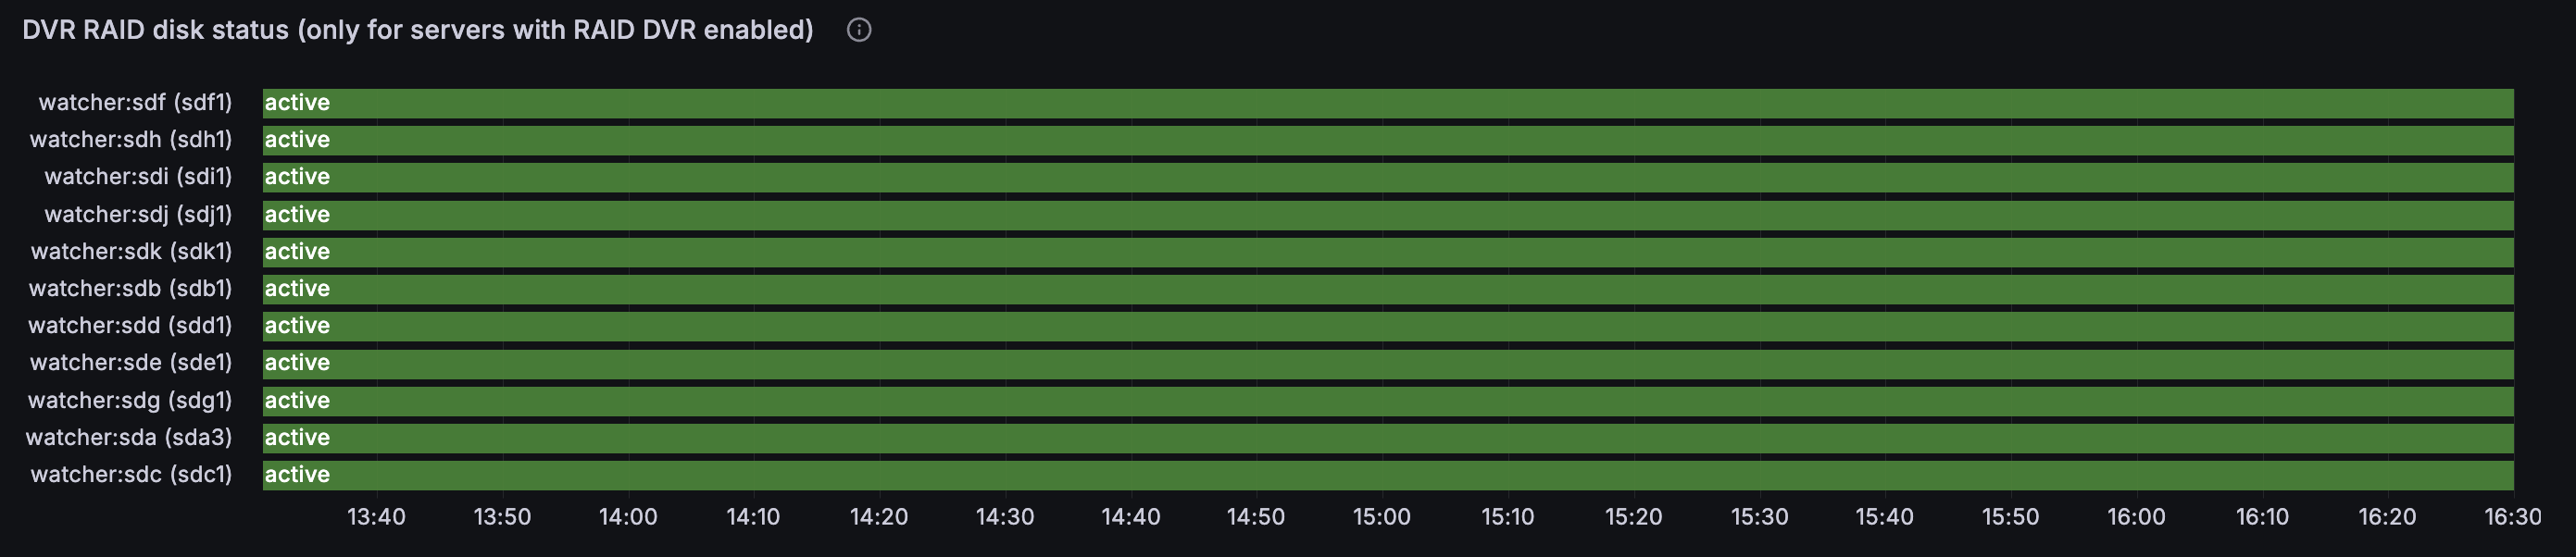
Per-disk status for the DVR RAID set on this server. Each member disk is shown as active (healthy) or degraded (faulty or missing).
This panel shows data only when DVR RAID is enabled for DVR. A failed or absent disk means the array is degraded: you no longer have full redundancy, and another failure can lead to loss of recorded archive. Treat this as urgent maintenance—replace or restore the disk before a second failure.
Example of Poor Disk Choice
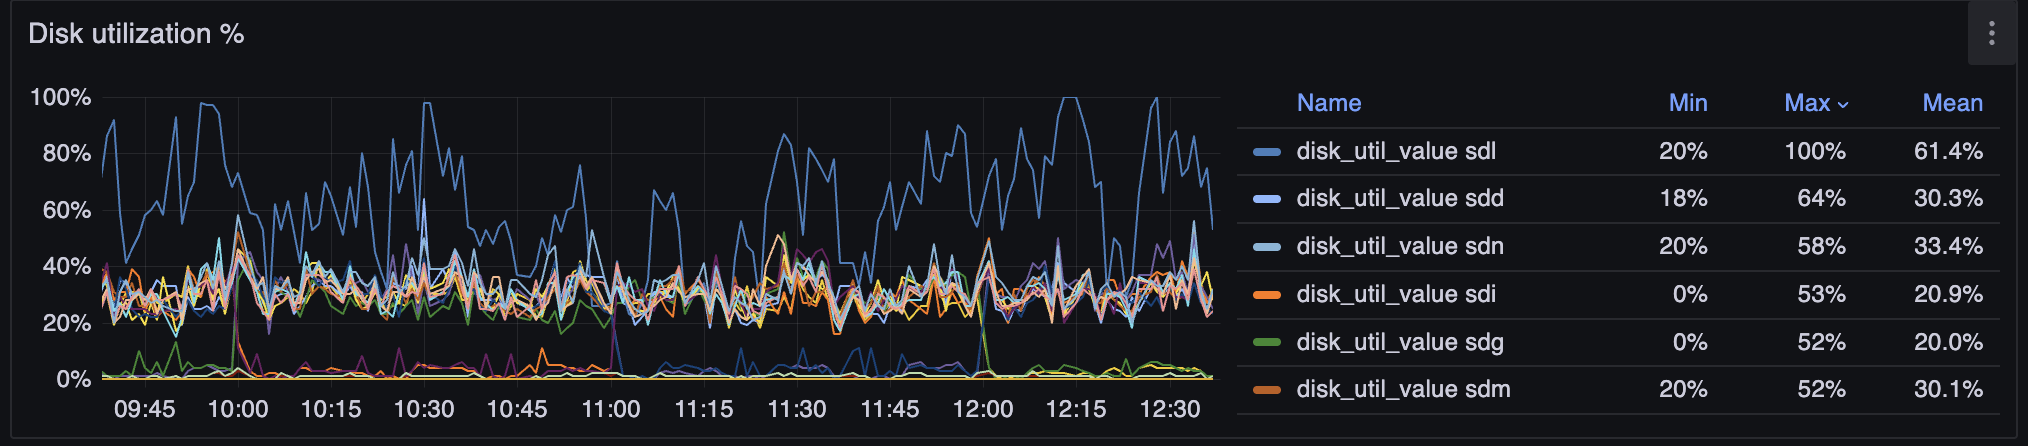
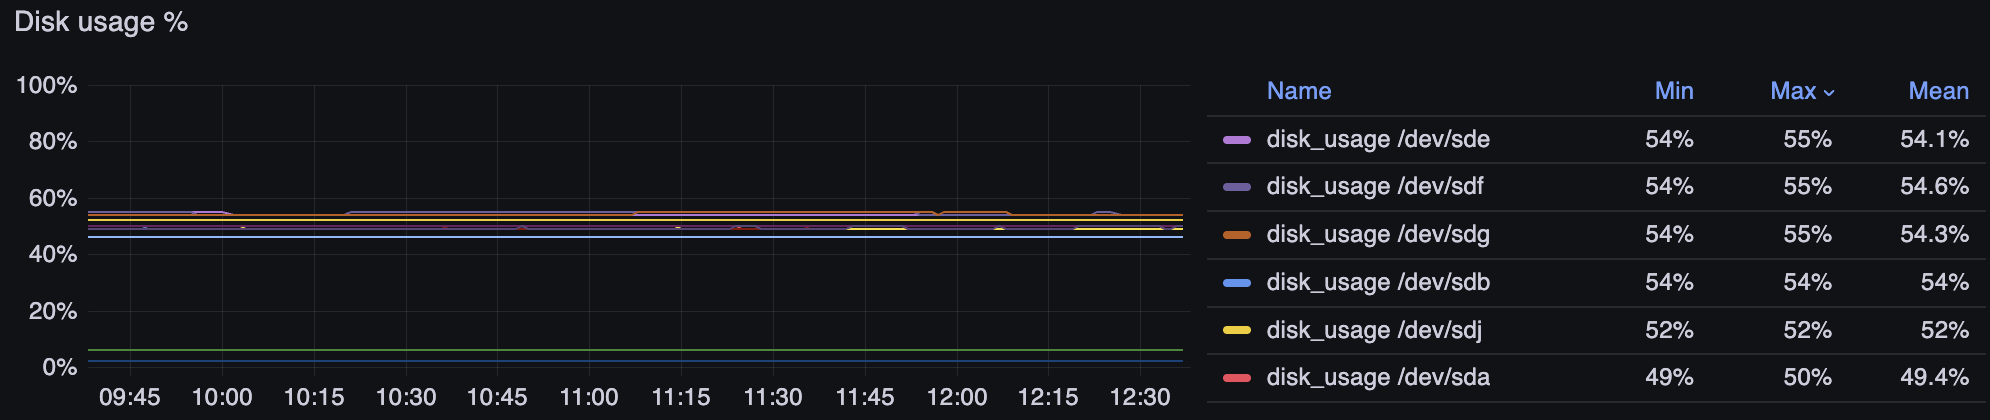
From the graphs above, you can draw the following conclusions:
- Disks were purchased very large and wasted - they cannot be filled with data
- Some disks are overloaded with writes. It might make sense to contact support for help finding a strategy for more even disk load distribution
- Flussonic RAID copes with protecting adjacent disks from overload. Despite one failing disk, the rest handle the workload
Streams and Clients
Monitoring of active streams and connected clients. This is an overview graph, more detailed picture is on adjacent dashboards.
Number of Streams
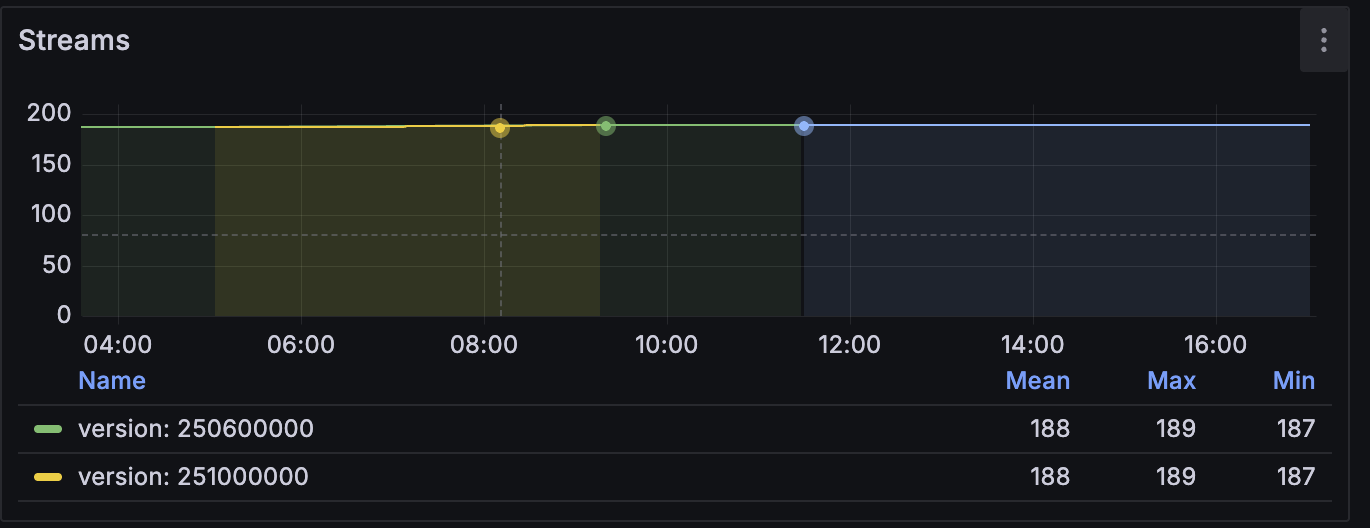
Each line is one stream status:
- Green, streams_running — the stream is running, its input receives data.
- Blue, streams_idle — the stream is not running, and that is expected: an on-demand stream with no viewers, a stream with no inputs, or a publish input with no broadcaster. Nothing to fix.
- Yellow, streams_waiting — the stream is starting or waiting for the first frames. This is a transitional state: a stream that stays here past the input timeout turns into an error.
- Red, streams_error — the stream is not running because of an error.
Not every server reports the idle status. A server that does not has no blue line.
Recommended to monitor during upgrades and ensure the picture doesn't change after upgrade.
Number of Clients
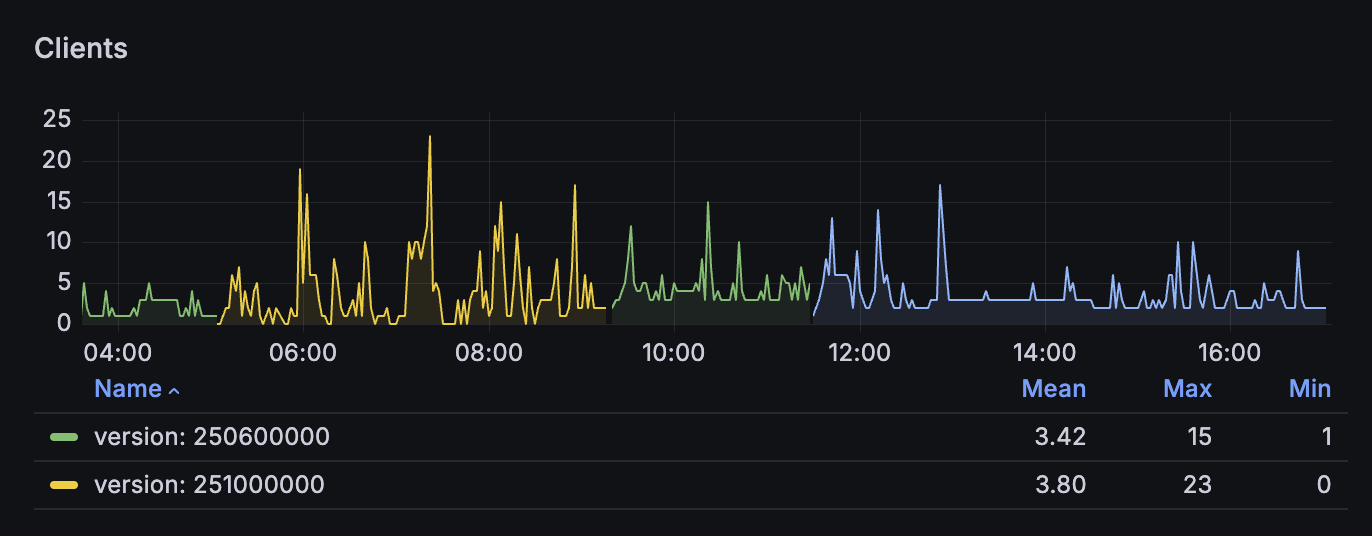
Recommended to monitor during upgrades and combine with load balancer operation, ensure the number reaches the pre-upgrade level.
Minutes in which the server did not report the number of clients are left out rather than drawn as zero.
3-Month Retrospective
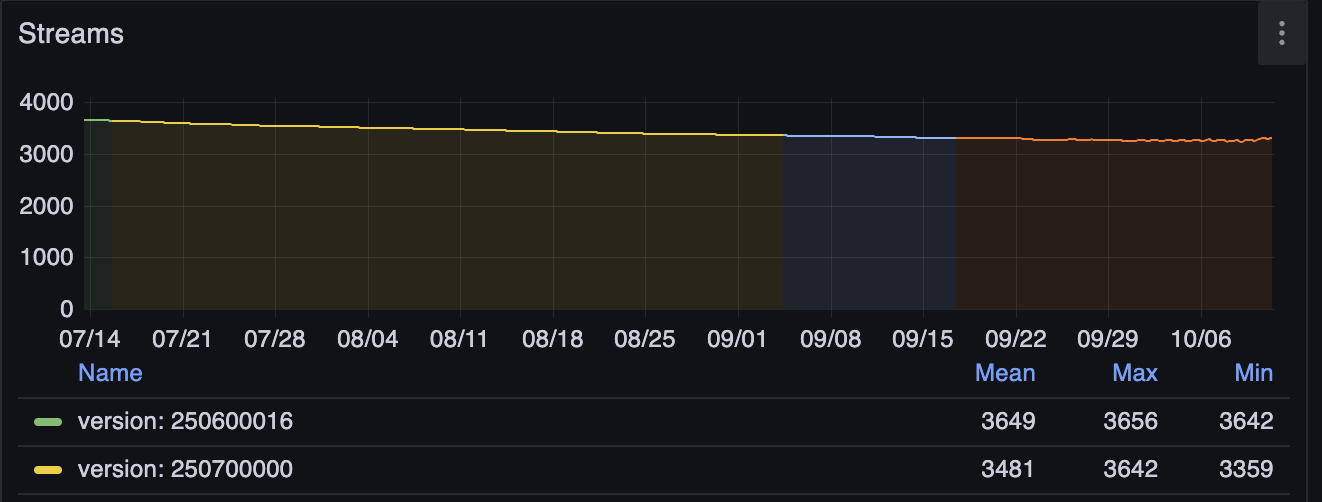
You can see that on this server over 3 months, the number of streams didn't change sharply - they are smoothly migrated to new servers.
Network Traffic
Monitoring of incoming and outgoing network traffic, in bits per second. Grafana scales the axis to Mb/s and Gb/s on its own.
Incoming media traffic
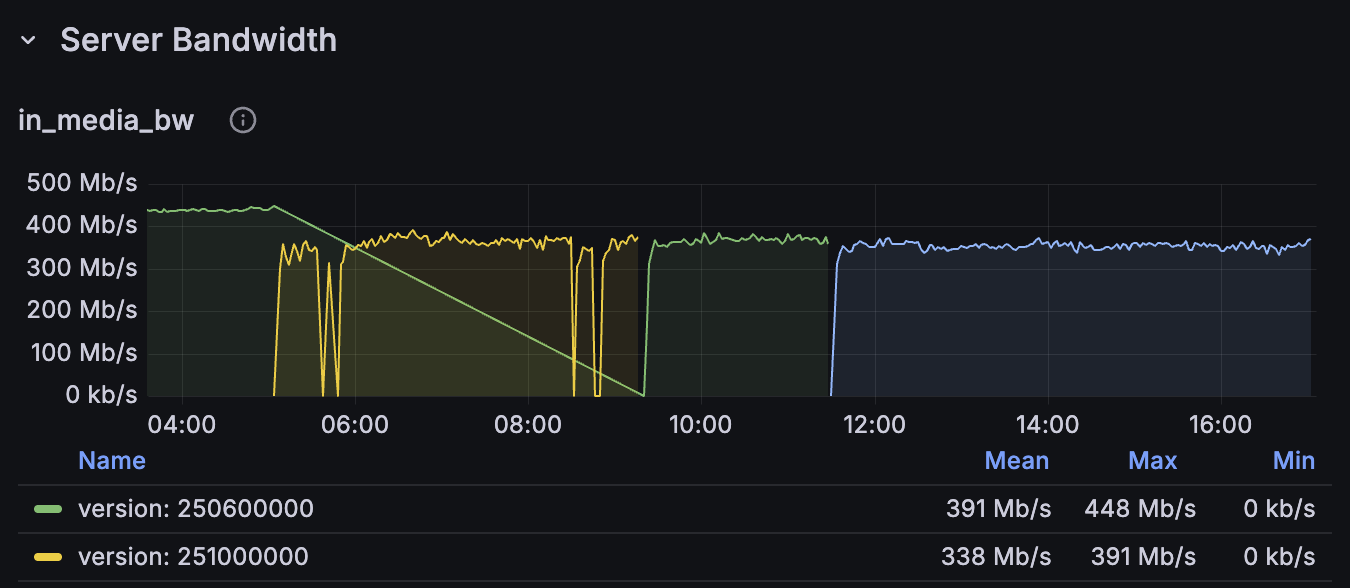
Gives an idea of how much incoming traffic the media server itself sees. Sometimes can differ radically from the system graph if there's capture from ASI, SDI, or loopback.
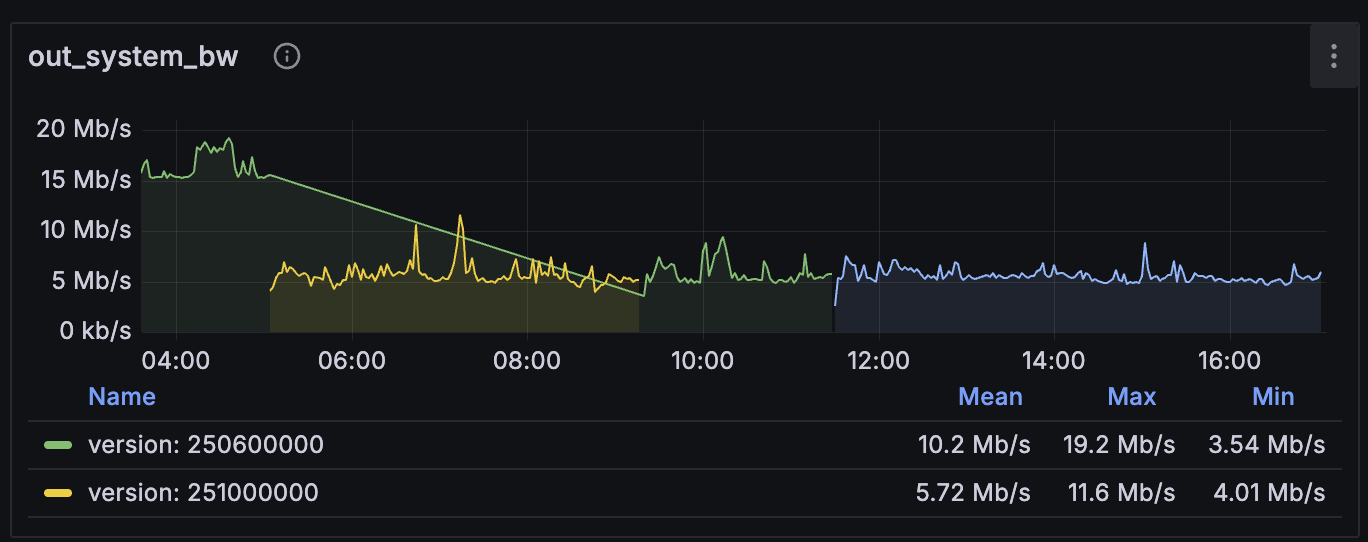
Incoming system traffic
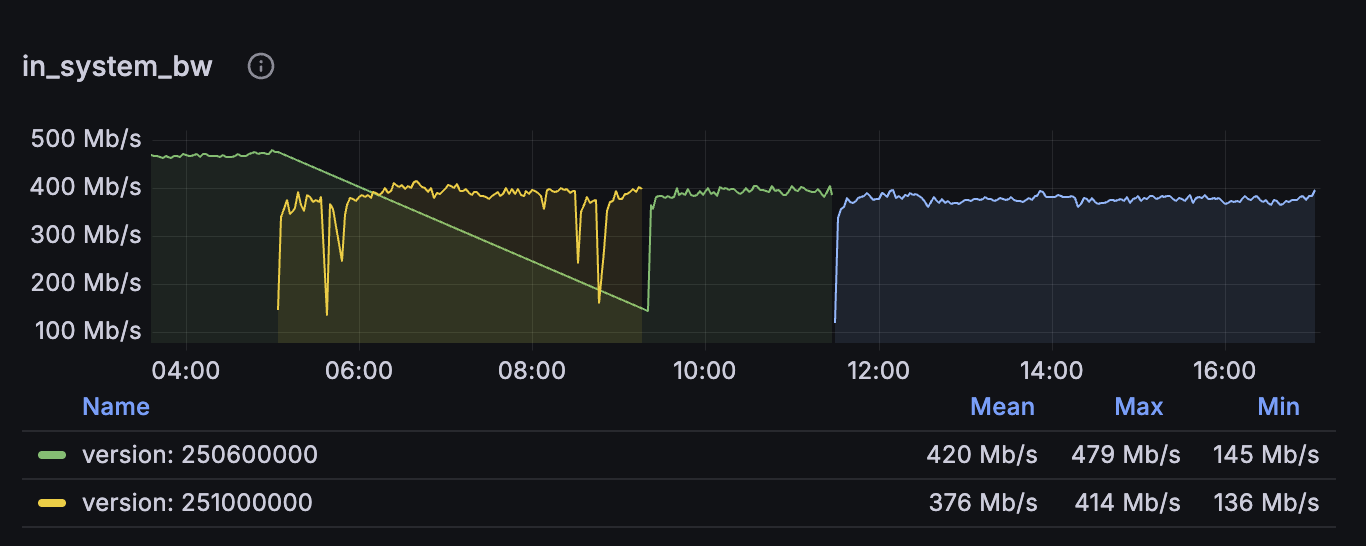
How much traffic enters the operating system. Can differ noticeably and be the cause of network failures if there are other traffic consumers besides the media server.
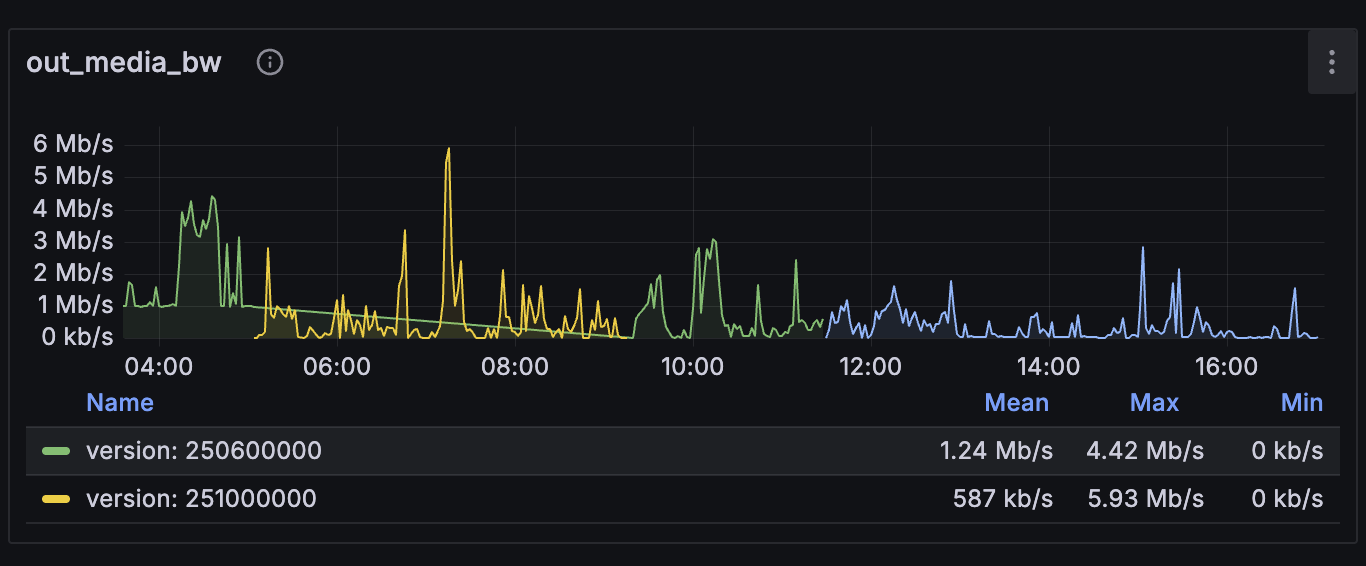
Outgoing media traffic
Outgoing system traffic
GPU Status
Monitoring GPU load and status for transcoding and video analytics.

The graph shows the overall utilization of the card. The encoding and decoding blocks load unevenly, so a moderate figure here does not mean there is headroom: NVENC can be fully occupied while the overall graph looks calm. The graph answers "is the card working or idle"; to investigate a resource shortage, read the card occupancy below.
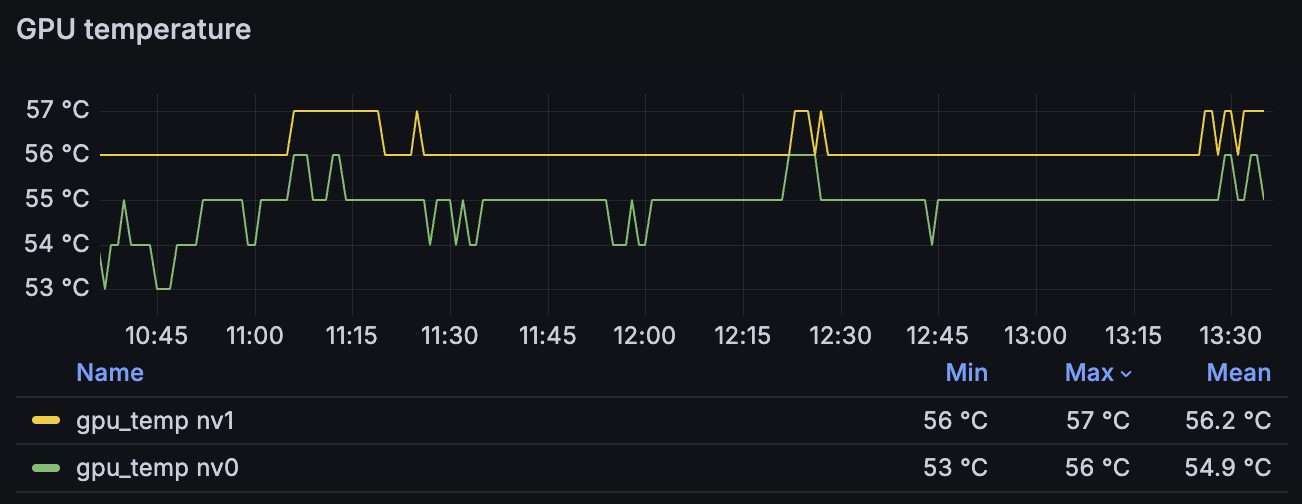
GPU cooling is mandatory. At high temperature the card starts behaving unpredictably and its behaviour is hard to diagnose: throttling, encoding sessions breaking off, refusals to hand out the card. All of it looks like a problem with the stream, the driver or the settings, and the temperature is the last thing anyone checks. If the graph is climbing toward 90 degrees, start the investigation here.
Installed Cards
The GPU park by compute capability, by architecture and by model tables show which NVIDIA cards are installed on the selected servers.

Each table has two columns: bucket — the value the park is folded by — and cards — how many cards with that value are installed on the selected servers.
The screenshot shows one park of three cards presented three ways: by compute capability — two cards at 8.9 and one at 7.5; by architecture — two ada and one turing; by model — two NVIDIA GeForce RTX 4090 and one Tesla T4. The card totals therefore match across all three tables.
They cannot be merged into one table: the server sends three independent foldings and does not send the link between them. In the screenshot the link can be guessed from the counts, but that is an accident of a small park — with more models there is nothing left to match rows on. The conclusion "an RTX 4090 is ada and 8.9" is drawn by a person; the data does not carry it.
Compute capability is the decisive table: CUDA and NVENC support matrices are written in sm_XX terms, not in generation names. Architecture and model are for the conversation with a person, not for answering "do we support this park".
The park is taken from the latest report of each server rather than summed over the interval: the inventory arrives in every report, and summing would multiply the number of cards by the number of reports.
Empty tables mean the selected servers have no cards. A server running an older version that does not report this GPU statistic never appears in the tables at all — these are different things. If a server is missing and you know it has cards, check its version.
Driver and CUDA
The NVIDIA driver and CUDA table shows the driver and CUDA versions on every server with cards, along with the number of installed cards.
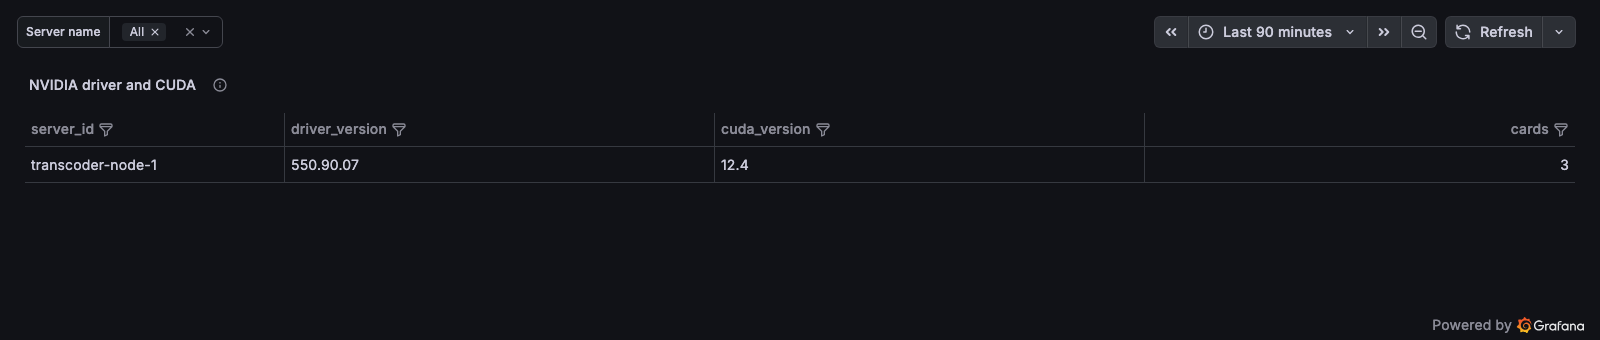
The driver version determines which codecs and encoding modes are available on the card: NVIDIA support matrices are written in terms of the driver and CUDA versions. This is where you look when planning a driver upgrade across the park, and when working out why a codec or a preset works on one server and not on another.
Cards Held vs NVENC Sessions
The Cards held vs NVENC sessions graph shows two quantities per card: how many transcoder pipelines hold it, and how many NVENC sessions the driver sees on it across every process of the machine.
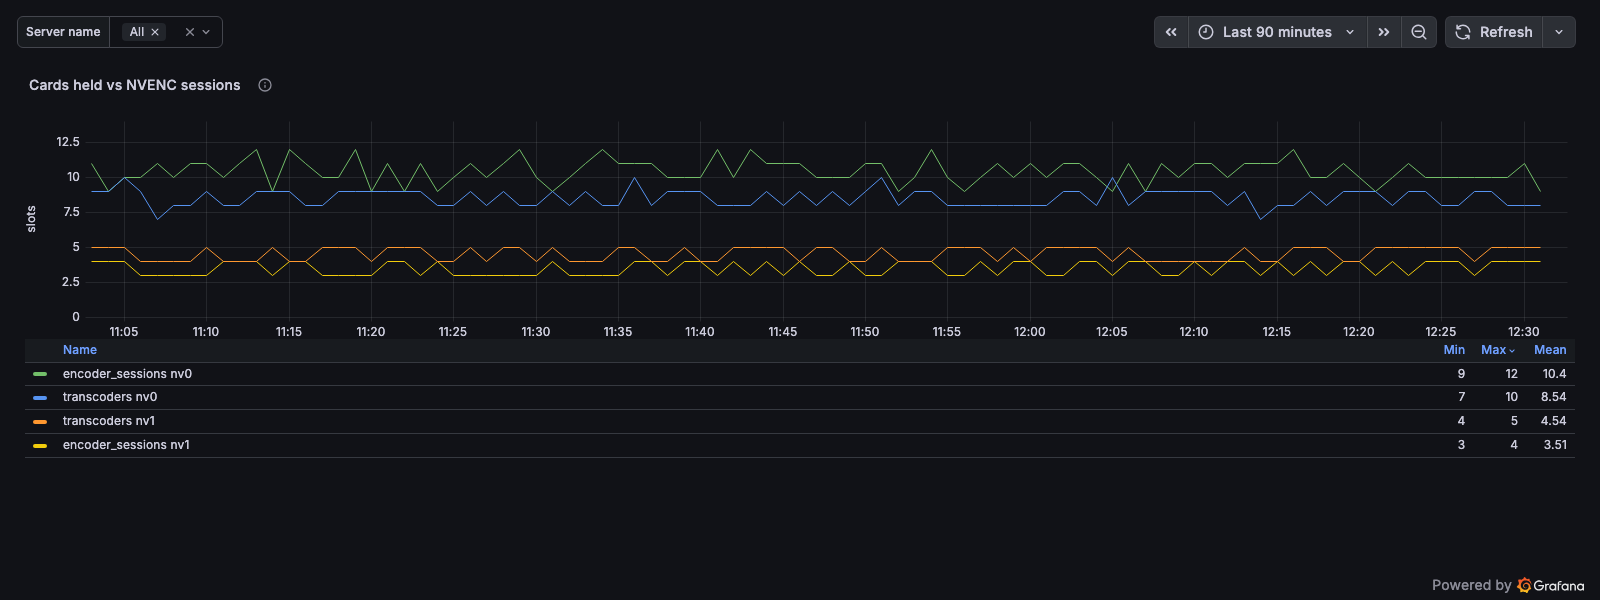
They diverge in both directions, and each direction means something:
- encoder_sessions above transcoders — somebody other than Flussonic is encoding on that card;
- transcoders above encoder_sessions — some streams hold the card but are not encoding right now.
On cards with a cap on concurrent NVENC sessions, channel density hits that cap before it hits the compute units. On such a park this pair is what explains quarantines caused by a refused encoding session: encoder_sessions flattens against the ceiling while acquire_failures on the graph below starts to grow.
Card Turnover
The Card turnover graph shows, per interval: how many times cards were taken, how many requests were refused, and how many times a card was taken out of selection.
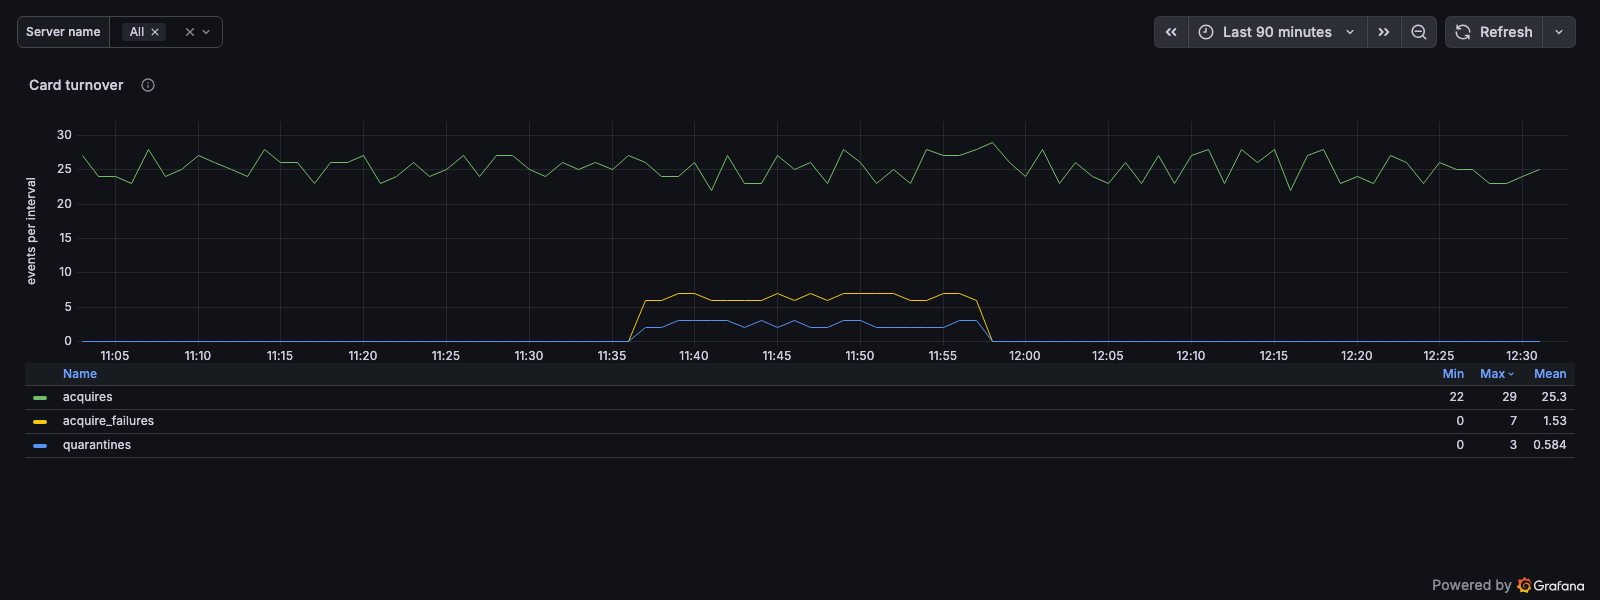
- acquires — the utilization graphs above do not remember turnover: two cards busy all night and streams grabbing a card thirty times an hour look identical on them;
- acquire_failures — demand the cards did not satisfy. It grows while occupancy stays flat, because the refused streams never got onto a card;
- quarantines — a card was taken out of selection: a CUDA context failed to build, or an encoding or decoding session was refused.
Streams per Card
The Streams per card table shows how many streams of the account sat on each card over the interval.
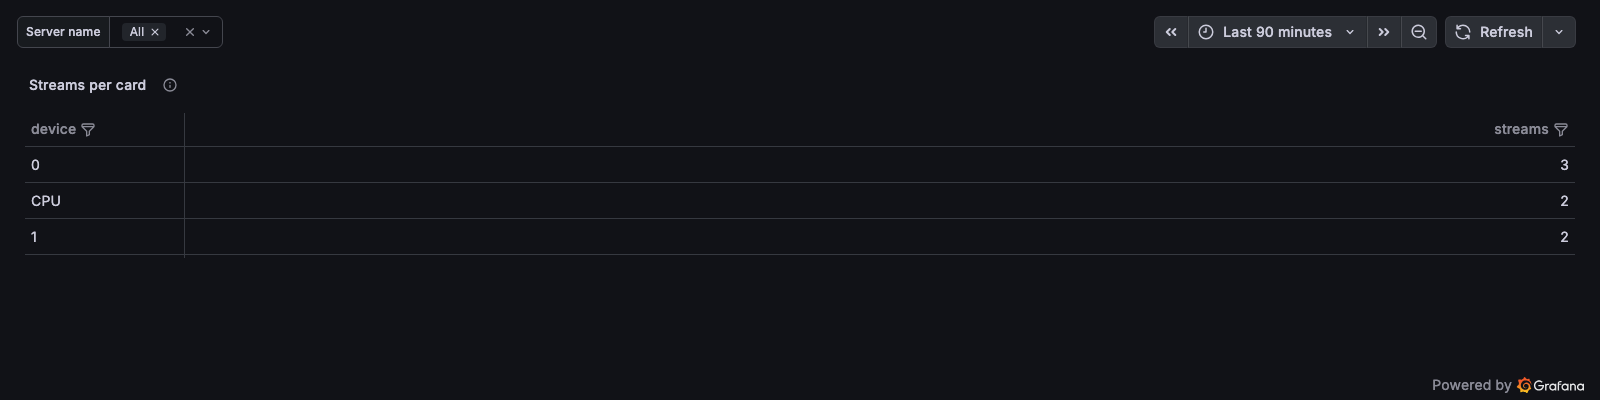
This is what the live exposition of a server cannot answer after the fact: which channels were on the card that went into quarantine last night.
The categories are the same as in the transcoder inventory:
- a number — the driver index of the card;
- CPU — a stream with no card at all;
- n/a — a stream on a server that does not send this field: whether it had a card is unknown.
It is counted the same way as the inventory on the transcoder dashboard, so the two tables cannot disagree.
GPU cooling is mandatory. If you let the temperature reach 90 degrees, the consequences can be very difficult to diagnose.
VOD File Transcoding
The collapsed row VOD transcoding (whole installation) shows what file transcoding is doing: how many jobs the broker settled, how many of them failed, and how much media was transcoded on the way.
The row answers for the whole installation and does not depend on the server selection at the top of the dashboard. File transcoding is run by a process with a central role, and the figures of each such node are only its share of the work. Only their sum over the installation is a meaningful number, and that is what the row shows.
An installation with no central role at all shows No data rather than zeros. Those are different answers: zero means "no jobs were settled", No data means "this is not measured here".
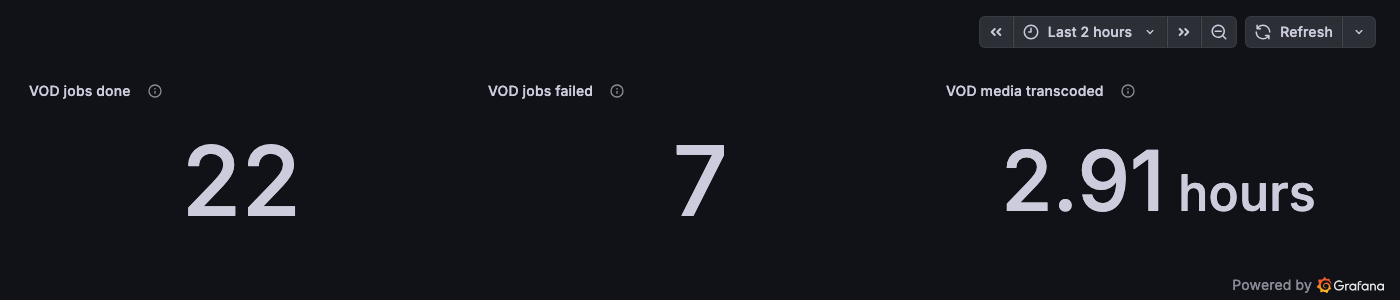
The three tiles are totals for the selected interval:
- VOD jobs done — jobs that ran to completion. The job is counted, not the executor attempt: a job retried three times and then finished counts once;
- VOD jobs failed — errors the broker does not retry: a terminal input or plan error, a crash, exhausted attempts, an executor that went silent. A retried attempt, a cancellation and a full queue are not outcomes and are not counted here;
- VOD media transcoded — the input duration of the finished jobs. This is the duration of the source, not the size of the output: a ladder of three renditions counts its source once.
Outcomes over time
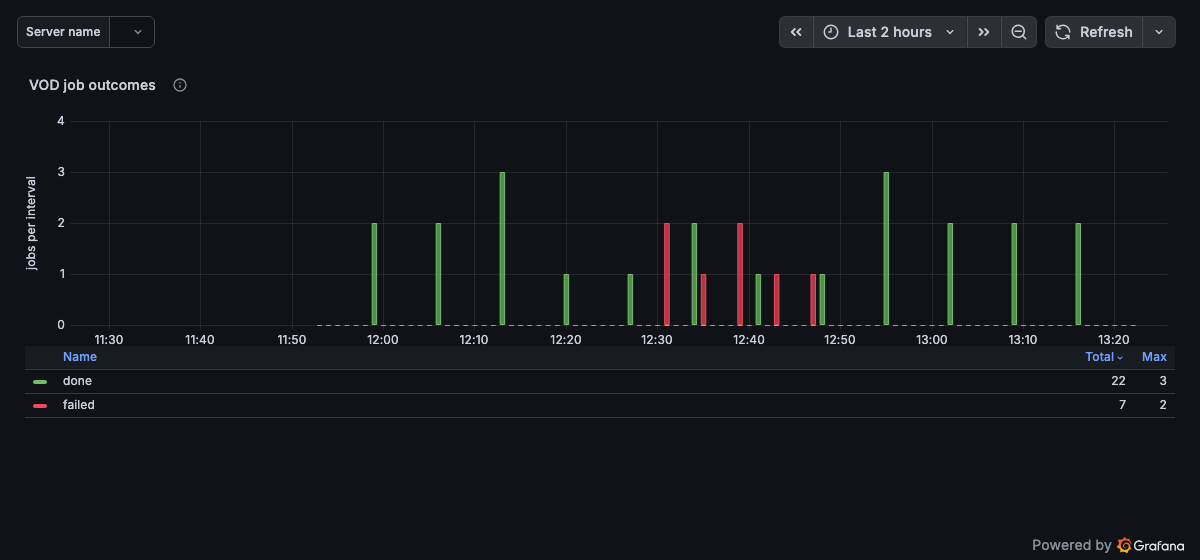
The same counters spread over the intervals. Counted per interval rather than per second: even a busy installation settles single jobs in a minute, and a rate would round to nothing.
How to read it:
- a band of failures that starts at one point in time is a change on the input side or a broken executor;
- failures scattered evenly across the range are usually the files themselves;
- failures with the done count at zero mean nothing gets through at all — start with the executors.
Telemetry does not carry the error code. To see why one particular job failed, open it in the broker's registry.
Media volume over time
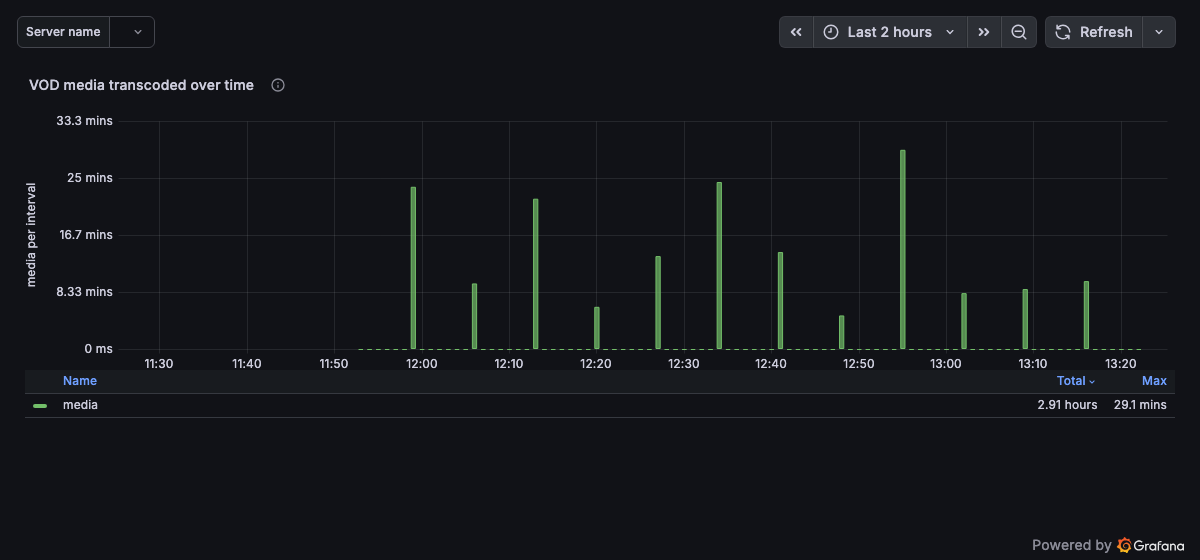
How much media was transcoded in each interval. Read it beside the outcomes: if the volume falls while the job count holds, the files got shorter — the transcoder did not slow down.
The first interval after a node restart is a baseline and reports nothing. Over a long range that is invisible; over a short one, it is one interval missing from the total.
Archive Export
An operator selects a segment on the archive timeline and downloads it as an MP4 file. This section shows how much archive the server handed out that way, and whether refusals get in the way.
The Archive handed out as files graph shows the volume of the delivered files over the interval.
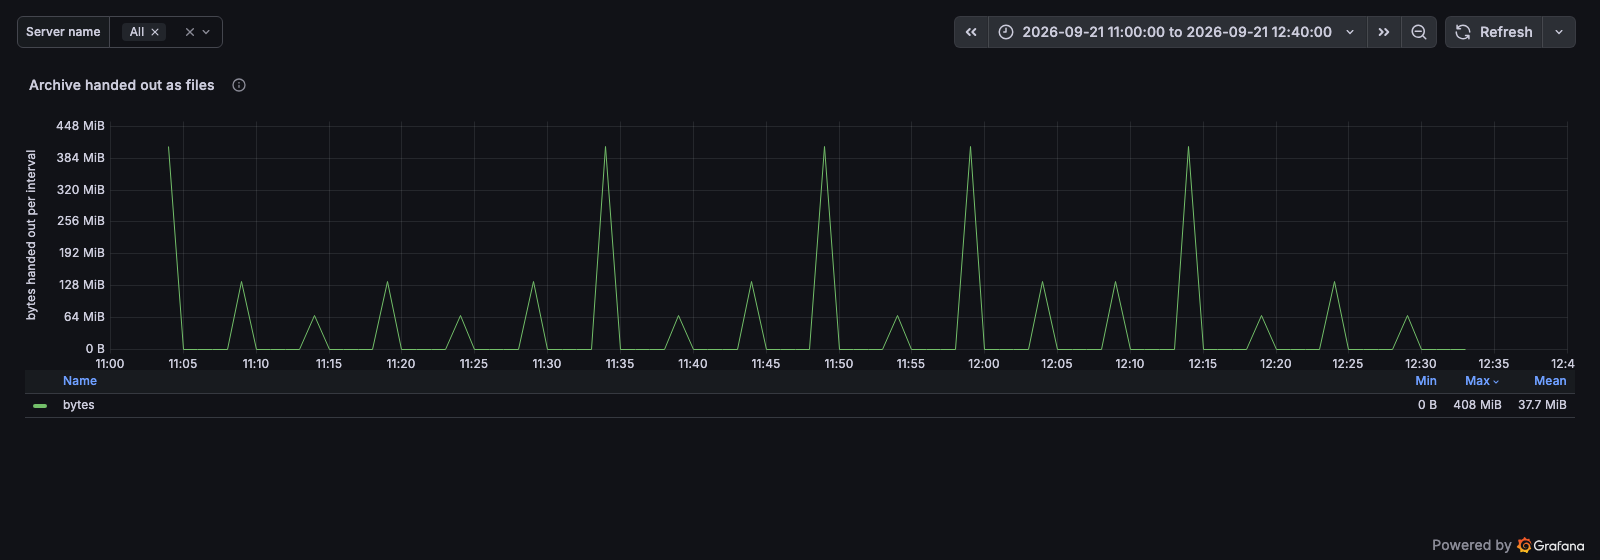
This counts the file size after gaps are glued and the tail is cut, not the width of the selection: from a two-hour selection holding twenty minutes of recording the server delivers those twenty minutes only. The headers-only request a player makes before downloading is not counted — only delivered files are.
The Exports refused by the node graph shows the refusals the server itself is responsible for: no free export slot, or a 5xx answer from the server.
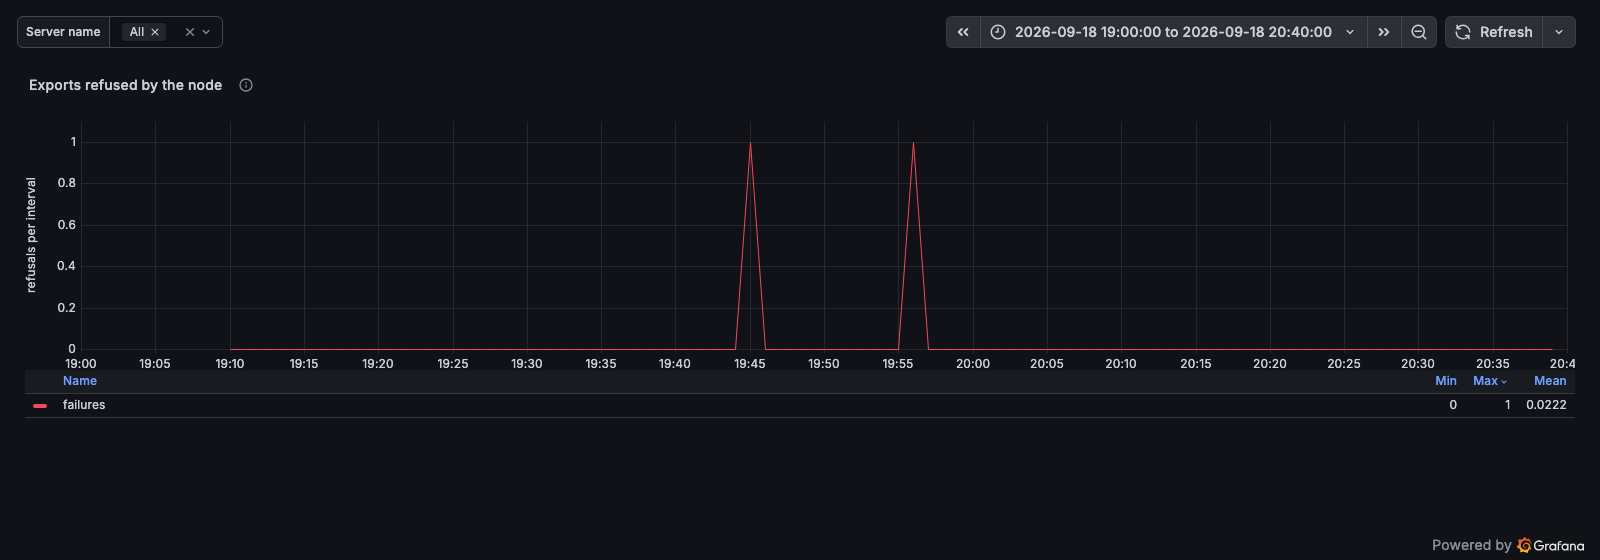
An invalid client request is not counted: an exceeded duration ceiling, an unknown track, a window the cleaner has already erased. None of these is a failure of the mechanism. The per-reason breakdown is available in the server's own exposition.
A server where the export was not used does not send these values, so an empty graph means no exports during the interval, not lost data.