Watcher Monitoring
The Watcher Monitoring dashboard provides an overview of Watcher cluster health: cameras and streams, on-site agents, streamers, channel relayouts, users, NVR devices, and the Vision video analytics module.
Unlike input monitoring on Watcher Streamer, this looks at Watcher orchestration — what is online, where a stream moved, how many Vision episodes were processed. The dashboard has no filters: a summary across the entire Watcher system connected to Retroview.
Base Metrics
The Base metrics block is a high-level view of core Watcher entities.
All three status graphs use the same status model (tooltip in Grafana via the i icon):
- operational — running normally, no issues;
- outage — completely unavailable;
- degradated — available but degraded (dropped frames, low resolution, etc.);
- partial_outage — only part available (e.g. video without audio);
- disabled — intentionally off or not expected to be active.
Graphs show the change in count of entities in each status per interval (increase(...)), not an absolute snapshot at a point in time. Growth in outage is a warning sign even when operational is still high.
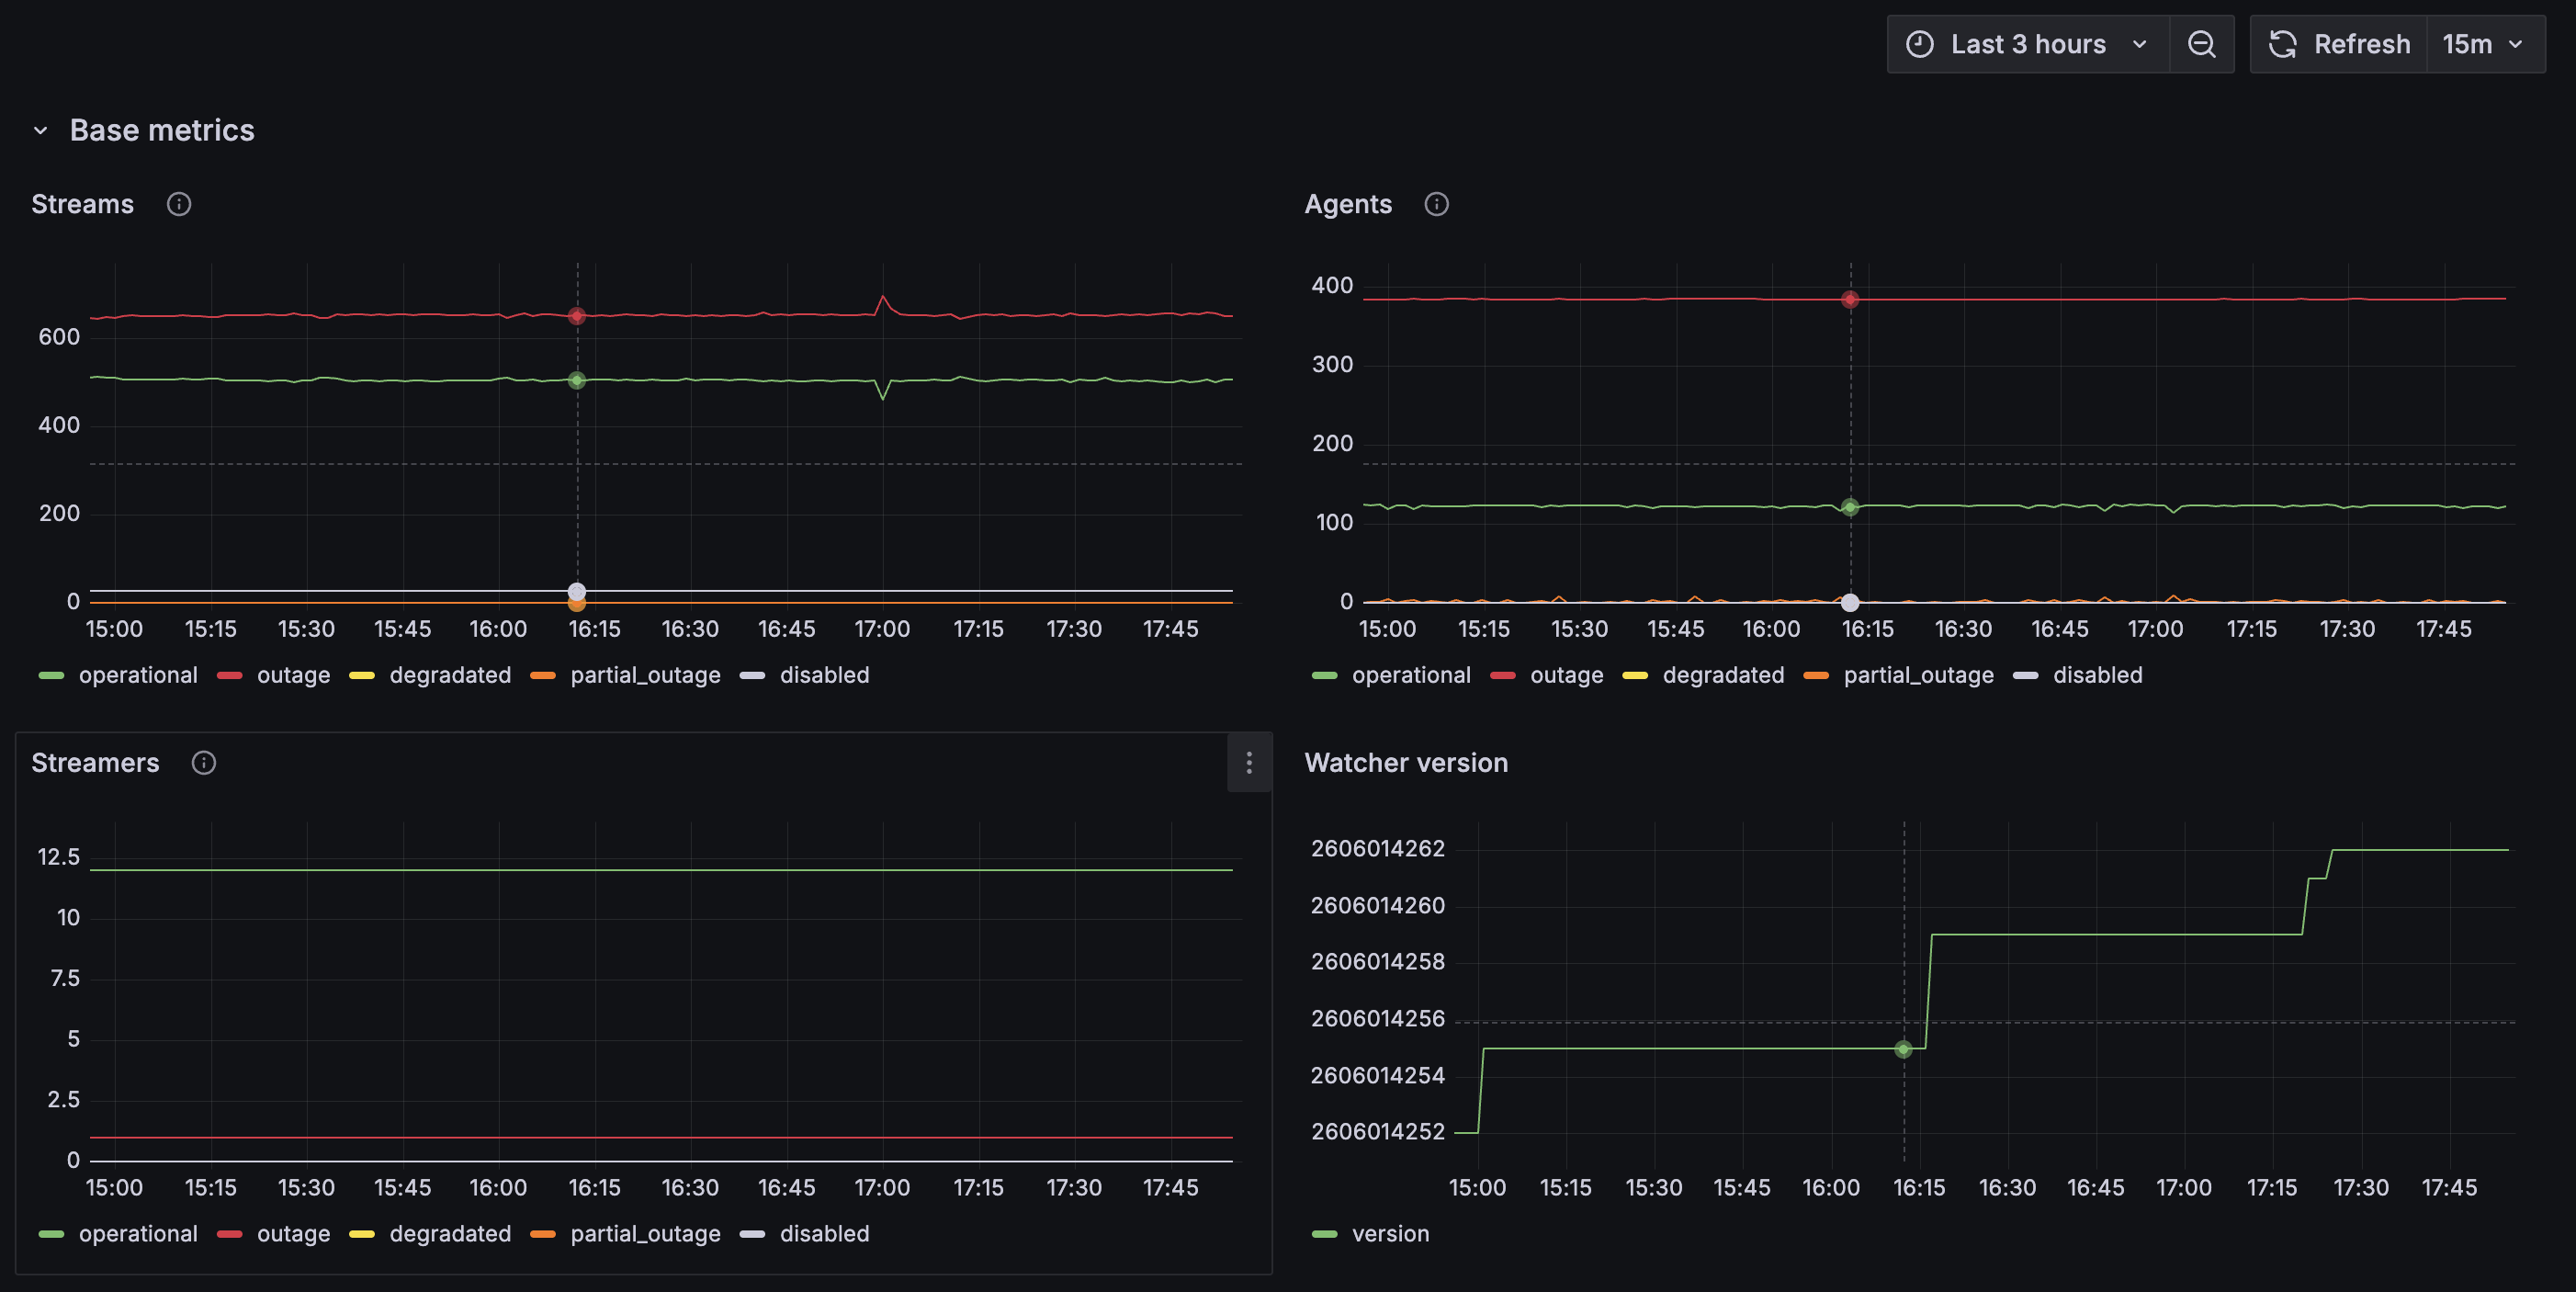
Streams
The Streams graph shows stream (camera) statuses in Watcher (watcher_stream_status).
The main indicator of video availability for users. If outage is consistently above operational — mass camera or agent issues. Growth in degradated with low outage — cameras are "alive" but viewing quality is degraded.
Agents
The Agents graph shows on-site agent statuses (watcher_agent_status).
An agent collects streams from cameras and delivers them to Watcher. Mass outage here often explains outage on the Streams graph: a problem on the site side (network, agent host, update), not on the streamer.
Streamers
The Streamers graph shows Watcher Streamer statuses (watcher_streamer_status).
Shows how many streamers in the cluster are healthy and how many are unavailable. A small absolute number (single digits to tens) is normal for a compact cluster; dynamics matter: any sustained outage warrants checking the Server Stats dashboard.
Watcher version
The Watcher version graph shows the Watcher version (watcher_version).
A stepped line on update or instance restart. Useful to correlate with outage spikes or Relayouts below: degradation after a version jump may be tied to a deployment.
Relayout and Stability
The second part of base metrics covers stream relayout events and Watcher stability.
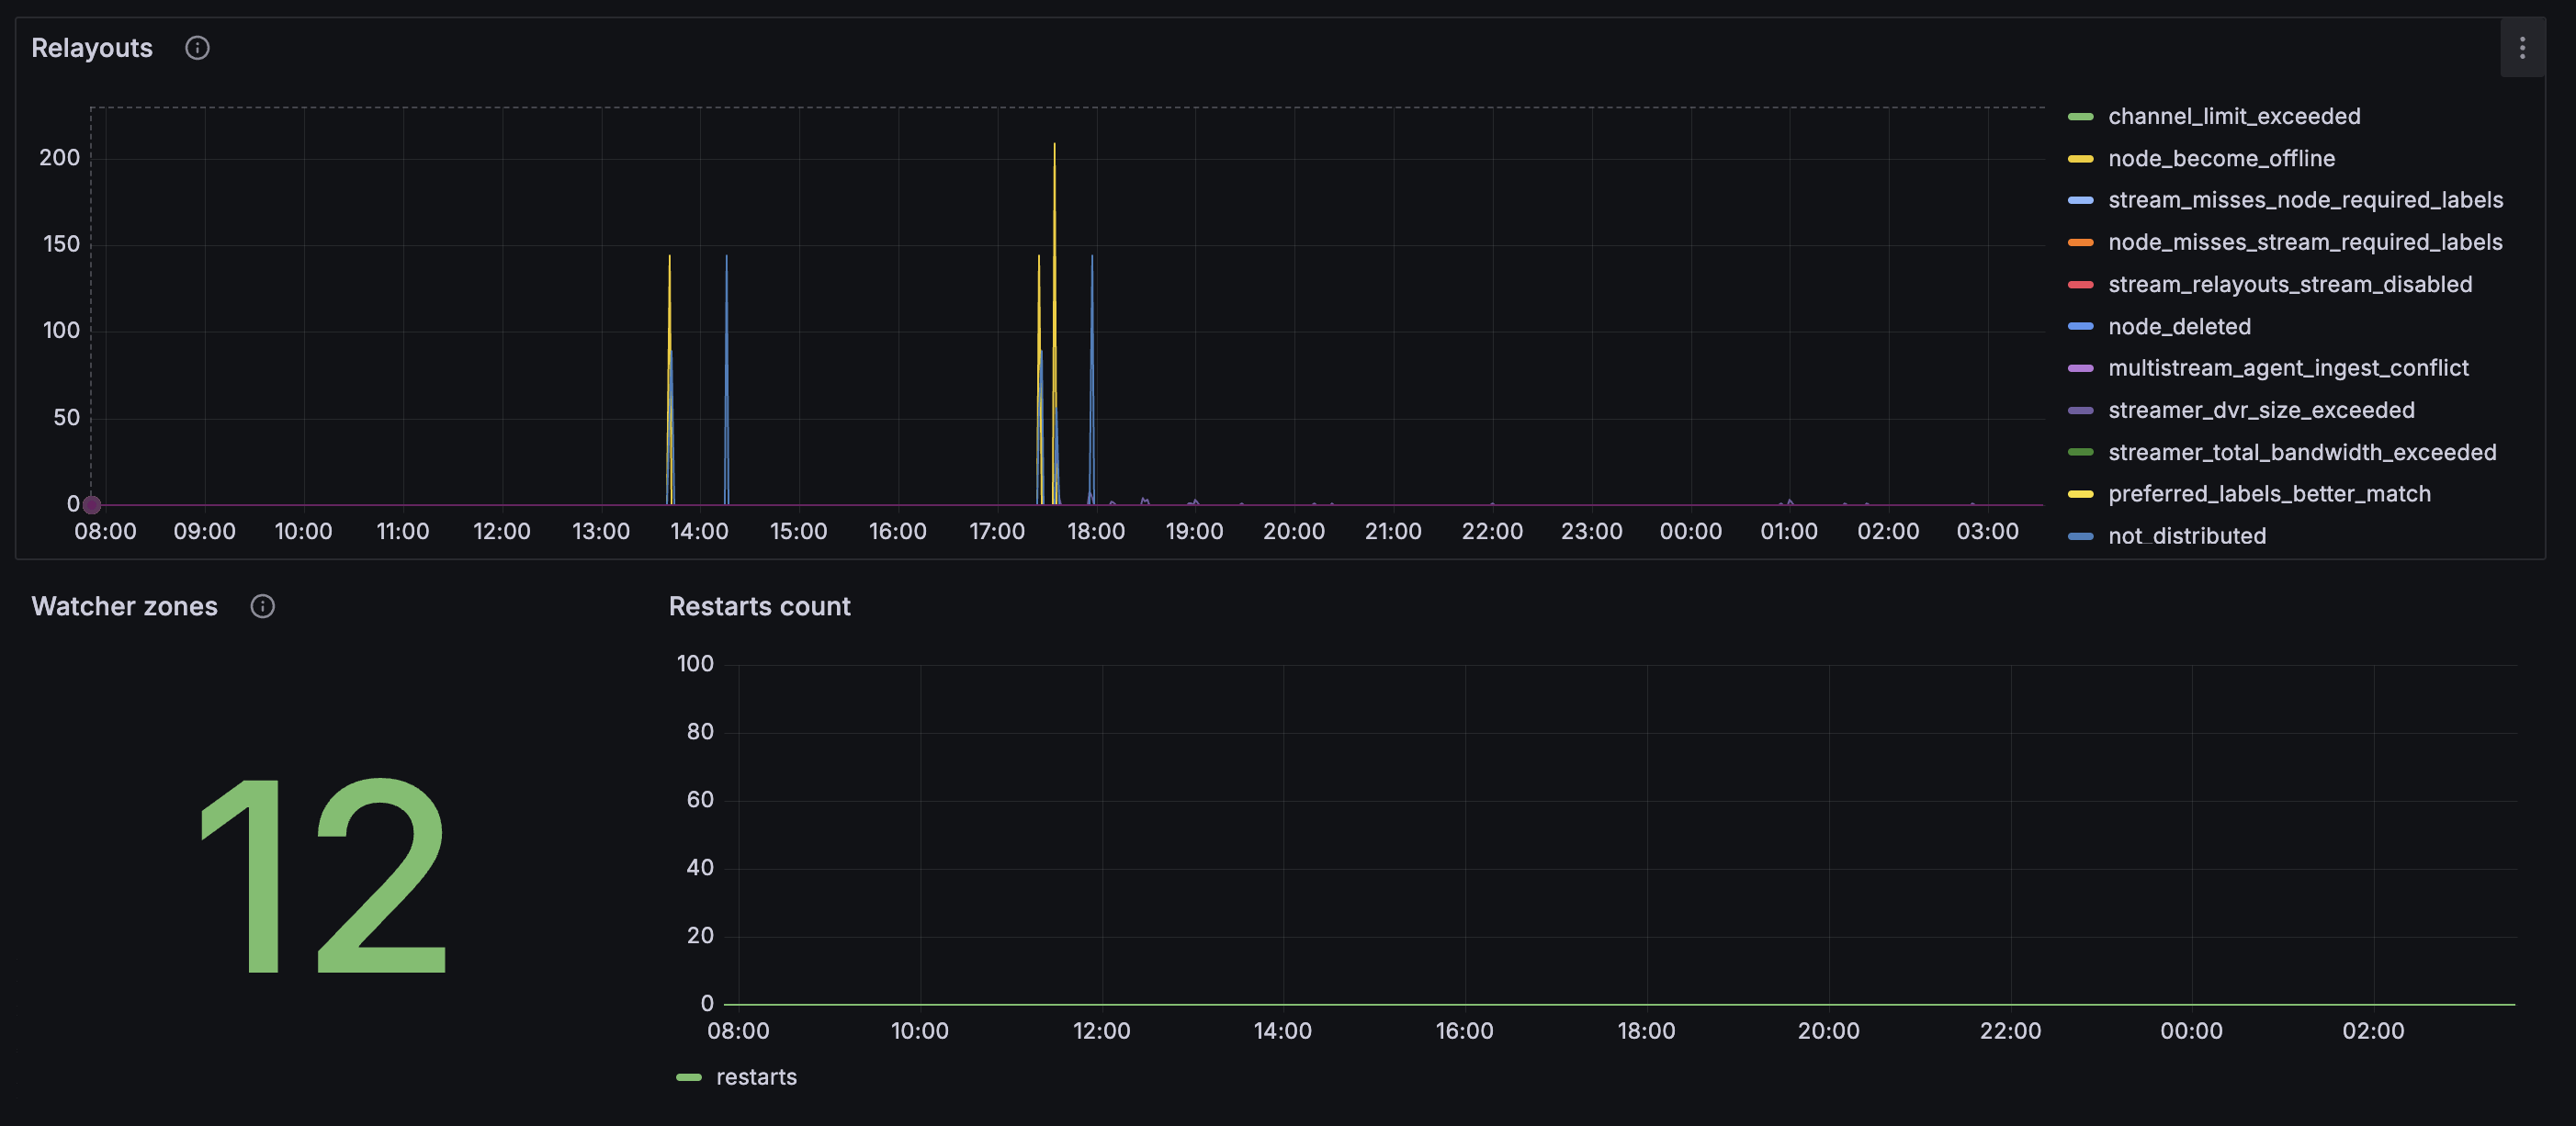
Relayouts
The Relayouts graph shows reasons a stream was moved from one node to another (watcher_relayouts_reason).
Each spike is one or more relayout events. Main reasons from the panel description:
- node_become_offline — the previous node became unavailable;
- node_channel_limit_exceeded — the node hit its channel limit;
- required_tags_dont_match — the node did not have the required labels for the stream;
- better_node_tags_match — a node with a better label match became available.
The graph may also show other reason codes (DVR limit, bandwidth exceeded, ingest conflict, etc.) — all mean Watcher redistributed the stream. Rare spikes are a normal reaction to a node failure. Constant "spikiness" on the graph means unstable balancing or insufficient cluster capacity.
Watcher zones
The Watcher zones panel shows the number of monitoring zones (watcher_zones_count).
Reference value: how many zones (logical groups of sites/cameras) are configured. A sharp change without planned work — check configuration.
Restarts count
The Restarts count graph shows Watcher restarts (watcher_restarts_count).
Normal is zero across the entire interval. Any growth means a Watcher instance restarted (deploy, OOM, crash). Correlate with Watcher version and outage spikes on streams.
Users and NVR
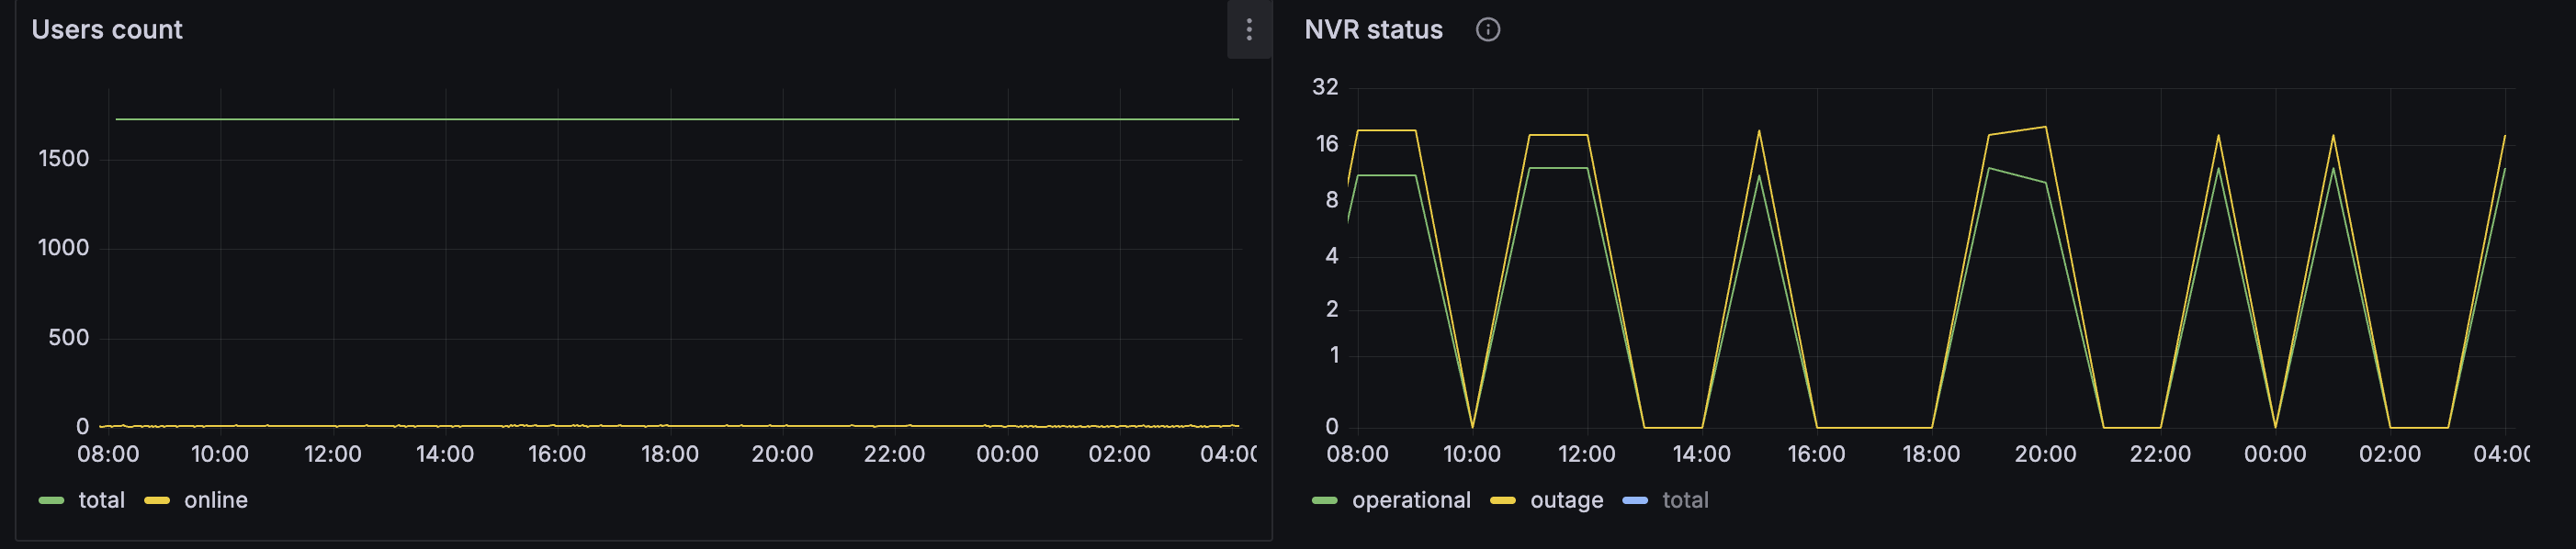
Users count
The Users count graph shows user dynamics (watcher_users_count by type):
- new — new users in the interval;
- existing — users already in the system.
In practice the legend may also show other types (e.g. total and online) depending on Watcher version — the idea is the same: how many accounts exist and how activity changes. A flat online line at zero with high total — users are registered but nobody is watching now (night, weekend) or a session issue — cross-check with session statistics.
NVR status
The NVR status graph shows NVR device state (nvr_count):
- operational — NVRs passing health checks;
- outage — NVRs unavailable or failing health check;
- total — total NVRs under monitoring.
outage should be minimal. Rhythmic simultaneous drops of operational and outage to zero may indicate periodic polling or unstable network to devices, not a real shutdown of all recorders.
Vision
The Vision block covers video analytics: episodes, errors, analytics-enabled stream health, and face recognition.
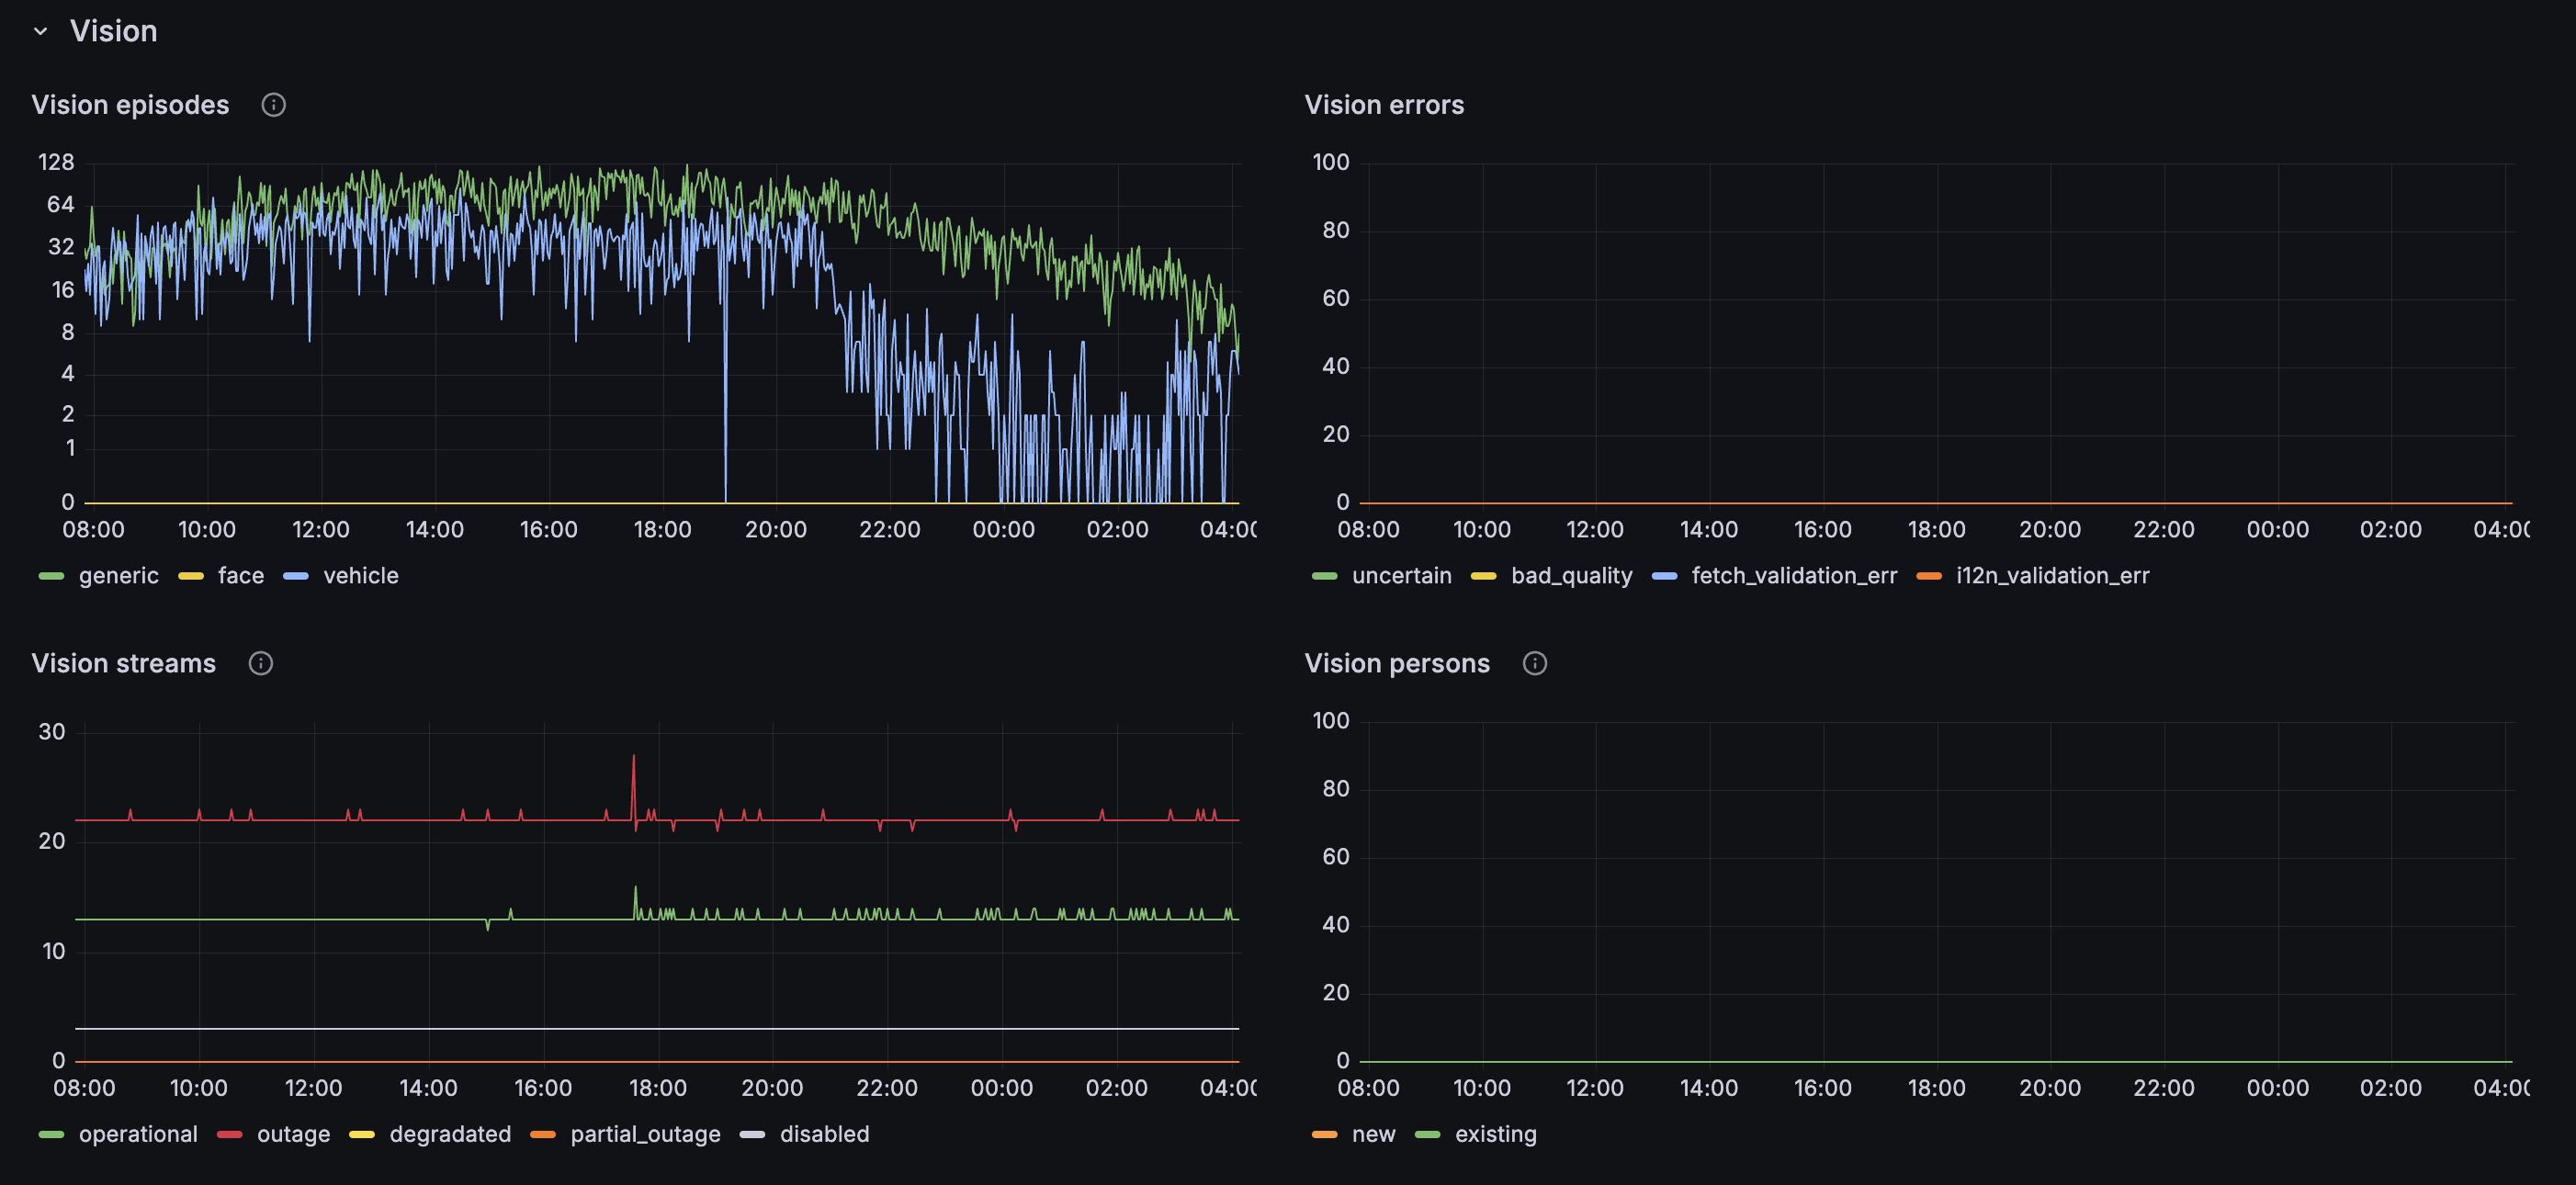
Vision episodes
The Vision episodes graph shows detected episodes by type (watcher_vision_episodes_type):
- generic — generic (non-specific) episode;
- vehicle — vehicle;
- face — human face.
Shows analytics activity: growth in vehicle and face with zero errors is normal. A sharp drop in all types with active cameras means analytics is not receiving frames or is disabled.
Vision errors
The Vision errors graph shows processing errors (watcher_vision_errors_type):
- uncertain — uncertain recognition;
- bad_quality — poor frame quality for analysis;
- fetch_validation_err — error fetching data;
- i12n_validation_err — validation error (including localization/format).
Normal is zero. Any sustained growth points to a source issue, network to the Vision service, or configuration. Check Vision streams and input monitoring for the relevant cameras first.
Vision streams
The Vision streams graph shows statuses of streams with analytics enabled (watcher_vision_streams_status).
Same statuses as Streams in the base block, but only for cameras with Vision. outage here with healthy operational on the general Streams graph means: live works, analytics is down on some cameras.
Vision persons
The Vision persons graph shows person recognition (watcher_vision_persons_type):
- new — newly identified faces;
- existing — faces already known to the system.
Reflects the face module. Dominant new — many unknown visitors or database retraining; stable existing — recognizable subjects in frame.
License Plate Recognition
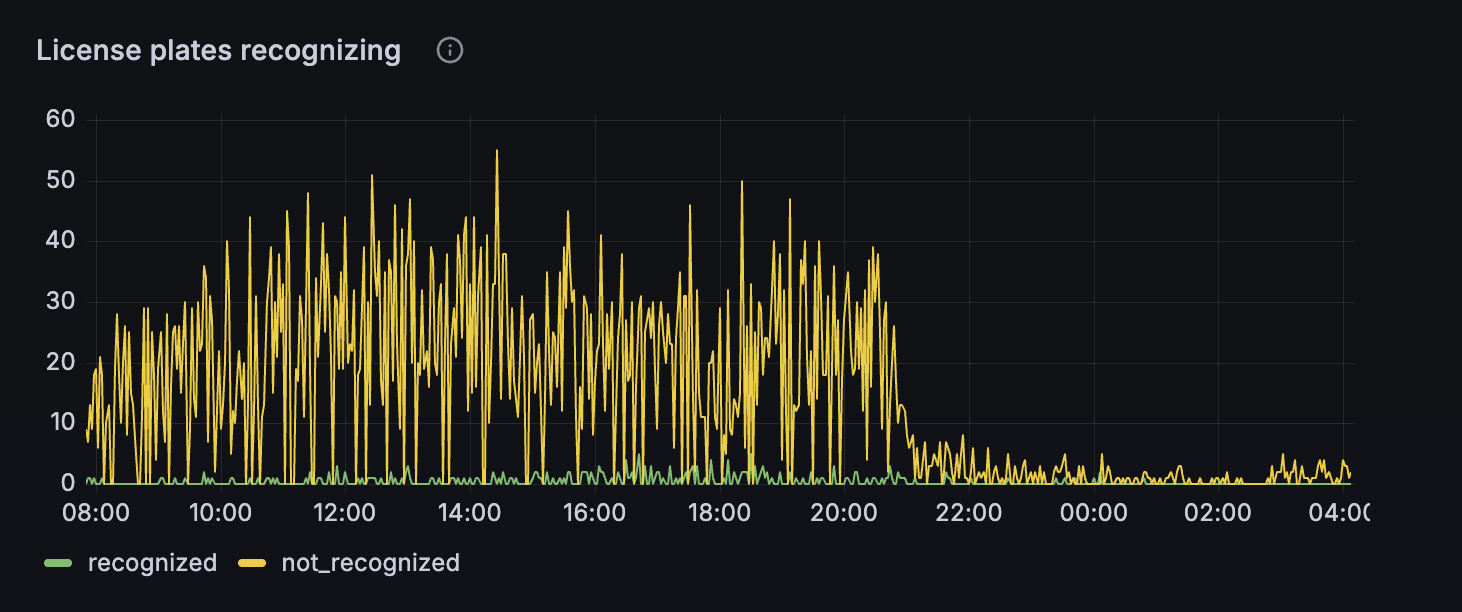
The License plates recognizing graph shows vehicle episodes and license plate recognition results (watcher_vision_episodes_license_plate):
- recognized — plate recognized;
- not_recognized — vehicle detected, plate not read.
High not_recognized with low recognized is typical for difficult conditions (camera angle, dirty plate, night, speed). Cross-check with Vision episodes → vehicle: if vehicles are detected but recognized is zero — tune framing and stream quality, not disable analytics.
Daytime spikes in not_recognized with a night drop match real traffic at the site. A sharp drop in both lines with active vehicle episodes — LPR module failure or lost stream on entry cameras.
Use Cases
Mass "cameras not working"
Start with Streams and Agents: if outage on agents — site-side problem. If agents are fine — Streamers and Server Stats.
After a Watcher update
Watcher version + Restarts count + spikes in Relayouts and outage — expected briefly; sustained outage — rollback or log analysis.
Poor analytics / no Vision events
Vision streams → Vision errors → Vision episodes. Zero episodes with fetch errors — network or streamer; with bad_quality — input quality.
Unstable balancing
Constant Relayouts with node_channel_limit_exceeded or streamer_total_bandwidth_exceeded — add streamers or reduce load on nodes.
NVR "flashing" in monitoring
Sawtooth NVR status — check device reachability and health check interval; do not confuse with a real failure of all recorders.