Transcoder Monitoring
The Transcoder monitoring dashboard shows how video transcoding performs on the server: whether the transcoder is stable, keeps up with real time, and how many output tracks it produces.
Unlike input monitoring, this is not about incoming signal quality, but about how the transcoder itself runs — CPU, GPU, quality profiles, logo and text burn-in. Frequent restarts and overload directly affect availability of transcoded stream versions for subscribers.
The recommended workflow: start with the Transcoded streams table — it lists every transcoded stream on the server and what each one costs. Click a stream name to load it into Stream name: the Stream transcoder details group opens below, and under it the collapsed groups covering cost, picture quality, output integrity and audio. The restart heatmap answers a different question — not "which stream is unhealthy", but "when exactly did it hurt".
Transcoder Inventory
The Transcoded streams on server table is the entry point of the dashboard. Every other panel needs a stream selected, which assumes you already know which stream you want to look at. This table answers the question that comes first: which streams on the server are transcoded at all, and what is happening to them.
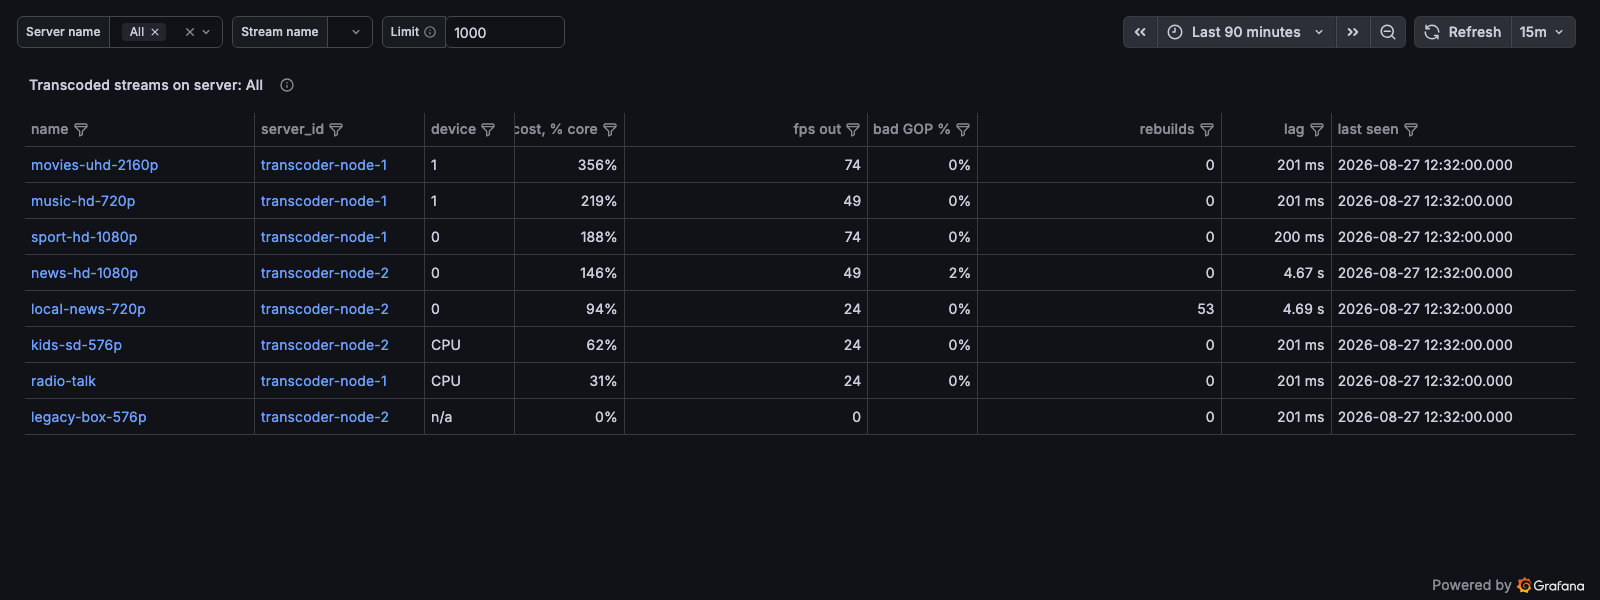
Rows are ordered by cost — the streams eating the most CPU time come first. Cost is measured in processor time only, and that holds for every stream: a stream on a graphics card also spends CPU — on preparing frames, on filters, on assembling the output — it just spends noticeably less on encoding. The load on the card itself is not in this column; that is on the Server Stats dashboard.
Every column is sortable and filterable in place, so what counts as "problematic" is your call: the share of corrupted GOPs, the number of rebuilds, or the lag.
Columns:
- name — the stream; clicking it loads the stream into Stream name and Server name, after which every panel below works;
- server_id — the server; clicking it opens the Server Stats dashboard;
- device — what the stream ran on: a card number, CPU, or n/a;
- cost, % core — how much processor time the stream costs, in percent of one core;
- fps out — how many frames per second it produces;
- bad GOP % — the share of damaged frame groups;
- rebuilds — how many times the output was rebuilt;
- lag — how far the output trailed real time, in milliseconds;
- last seen — when the stream last reported.
The acceleration setting and the time the output spent blocked are not in this table — they are on the per-stream panels below. The table is for picking a stream, not for reading everything about one.
Three columns read differently than they first appear.
cost is the average share of one core over the selected interval, not over the time the stream was running. A stream that ran for a tenth of the interval and cost two cores while running shows about 20 % here. That is deliberate: the table ranks by total resource consumption, not by instantaneous weight. On the Transcoder cost panels the same quantity is computed per bucket and reads noticeably higher — that is not a data discrepancy.
device is a category, not a number, and a graphics card is only one of its three possible values:
- a number — the driver index of the card the stream occupied;
- CPU — no card at all: a software transcoder, a passthrough stream, or a stream that asked for a card and never got one;
- n/a — no data. A server of that version does not send the GPU field, so whether this stream had a card is unknown. That is not the same as CPU.
bad GOP % is empty when the stream fed no frame groups into the transcoder over the interval. There is simply no share to speak of — which is not the same as "no artifacts".
A stream appears in the table if it left any trace of a transcoder over the interval, not only when the transcoder was on the whole time. This matters when investigating yesterday's incident: a stream whose transcoder was down part of the time does not drop out of the list.
The number of rows is bounded by the Limit variable at the top of the dashboard (1000 by default, 50000 maximum).
Use Cases:
- Complaint that the server is slow: sort by cost and see which streams eat the CPU
- Complaint about broken picture with no stream named: sort by bad GOP %
- Verify streams have not slipped off the GPUs onto the CPU: filter device by CPU
- Find the streams on a card that went into quarantine: filter device by its number
Transcoder Restarts
The Top N streams with transcoder restarts on server panel is the main entry point for diagnostics.
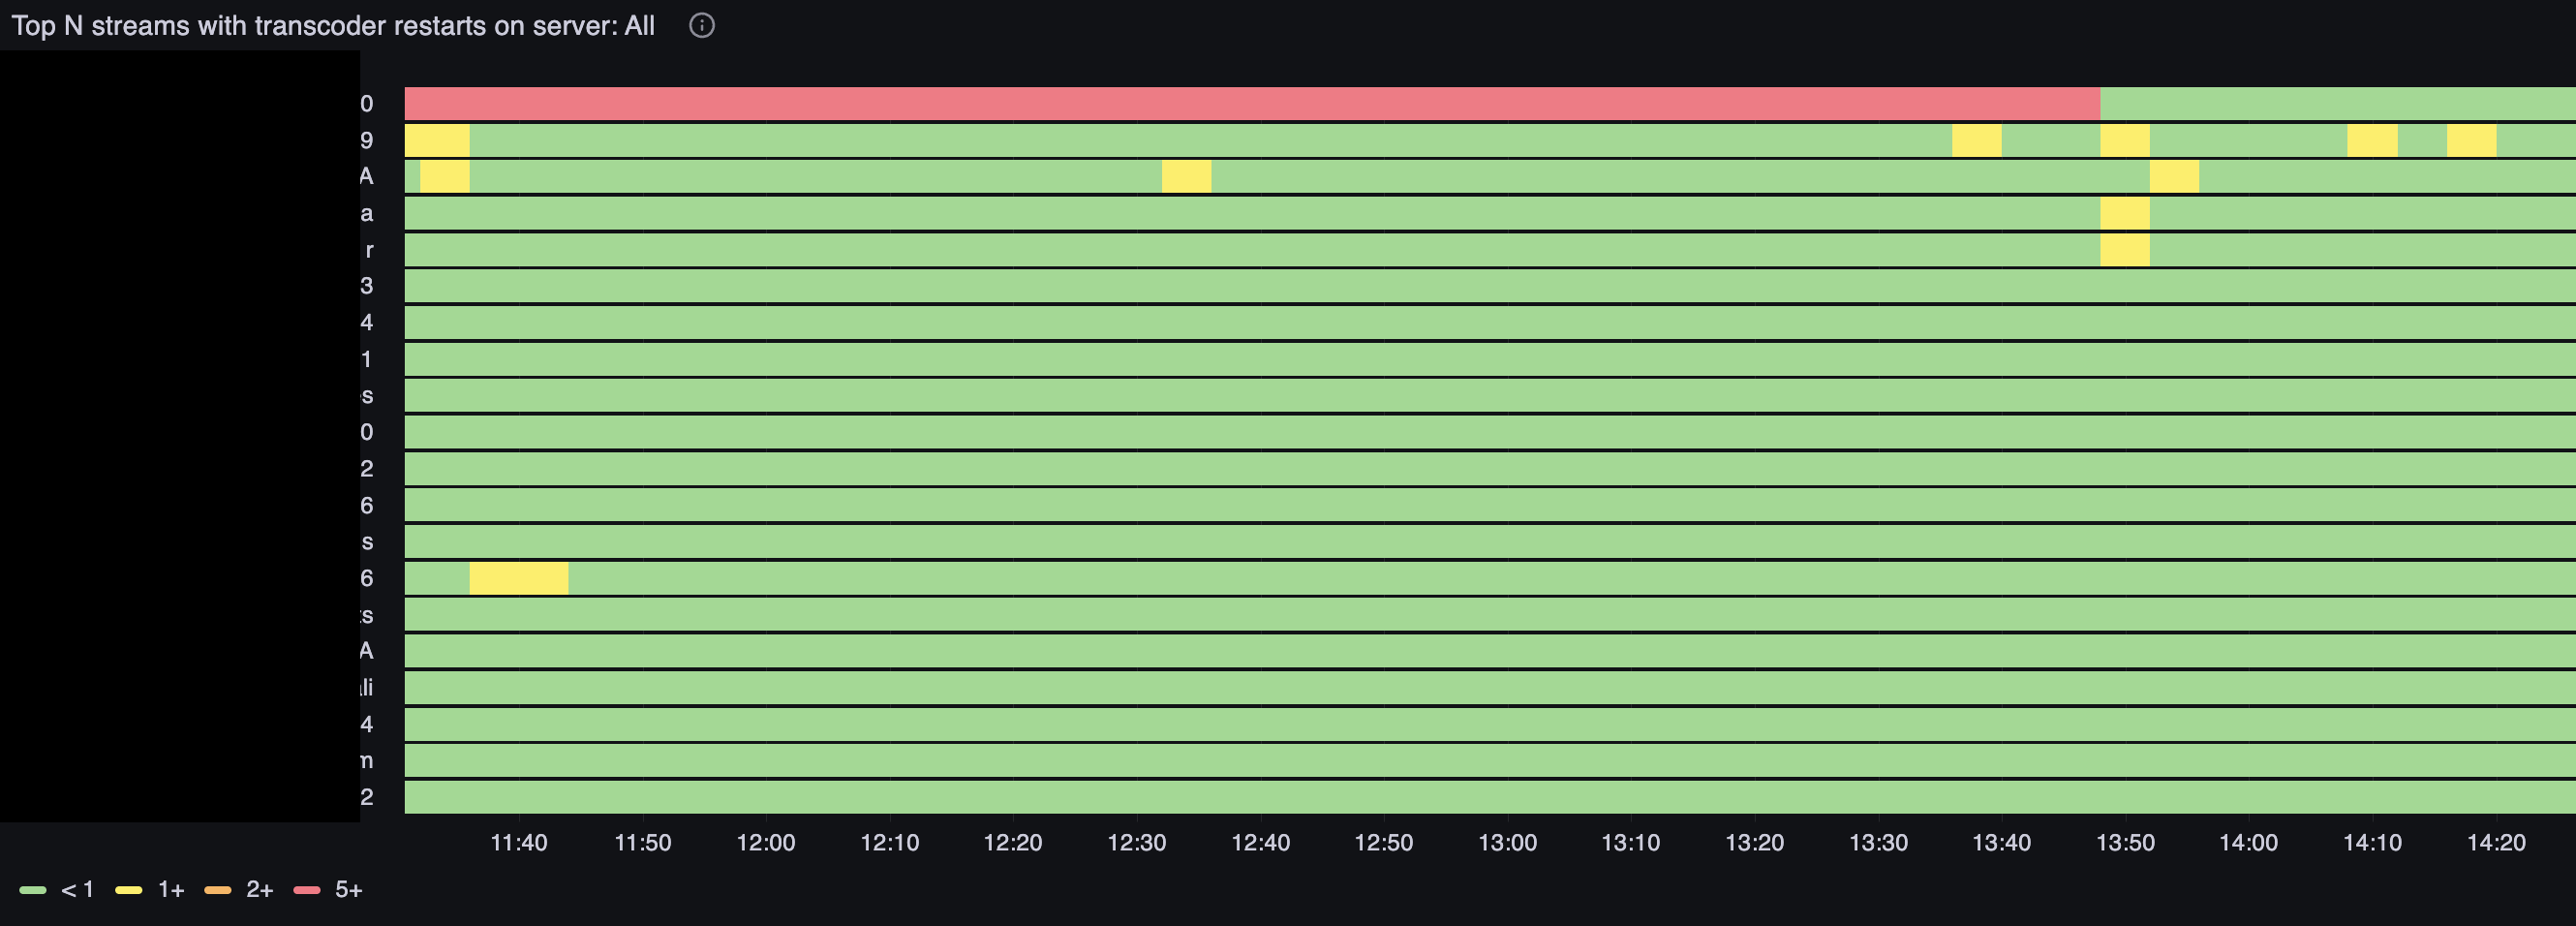
This is a heatmap (state timeline): streams with the most restarts are listed vertically, time runs horizontally. Cell color shows the transcoder_restarts metric value for each interval:
- green — less than one, normal, transcoder is stable;
- yellow — 1 and above, at least one restart occurred;
- orange — 2 and above, repeated restarts;
- red — 5 and above, critical instability.
Frequent restarts mean the transcoder cannot maintain a steady state: it crashes due to input errors, resource shortage, parameter changes, or an internal failure. Streams with the most restarts over the selected period rise to the top.
At the top of the dashboard, select Server name — a single server or All for a summary across the entire infrastructure.
Use Cases:
- See a red or orange band, click the stream row, and drill down in the dashboard below
- Over several days, notice the same stream regularly in the top — look for a systemic cause (server overload, unstable source, overly heavy transcoding profile)
- Correlate restarts with issues on input monitoring — transcoders often crash because of broken input
Set up alerts: watch CPU load, scheduler load, and GPU on the Server Stats dashboard — transcoding is directly dependent on server resources.
Stream Transcoder Details
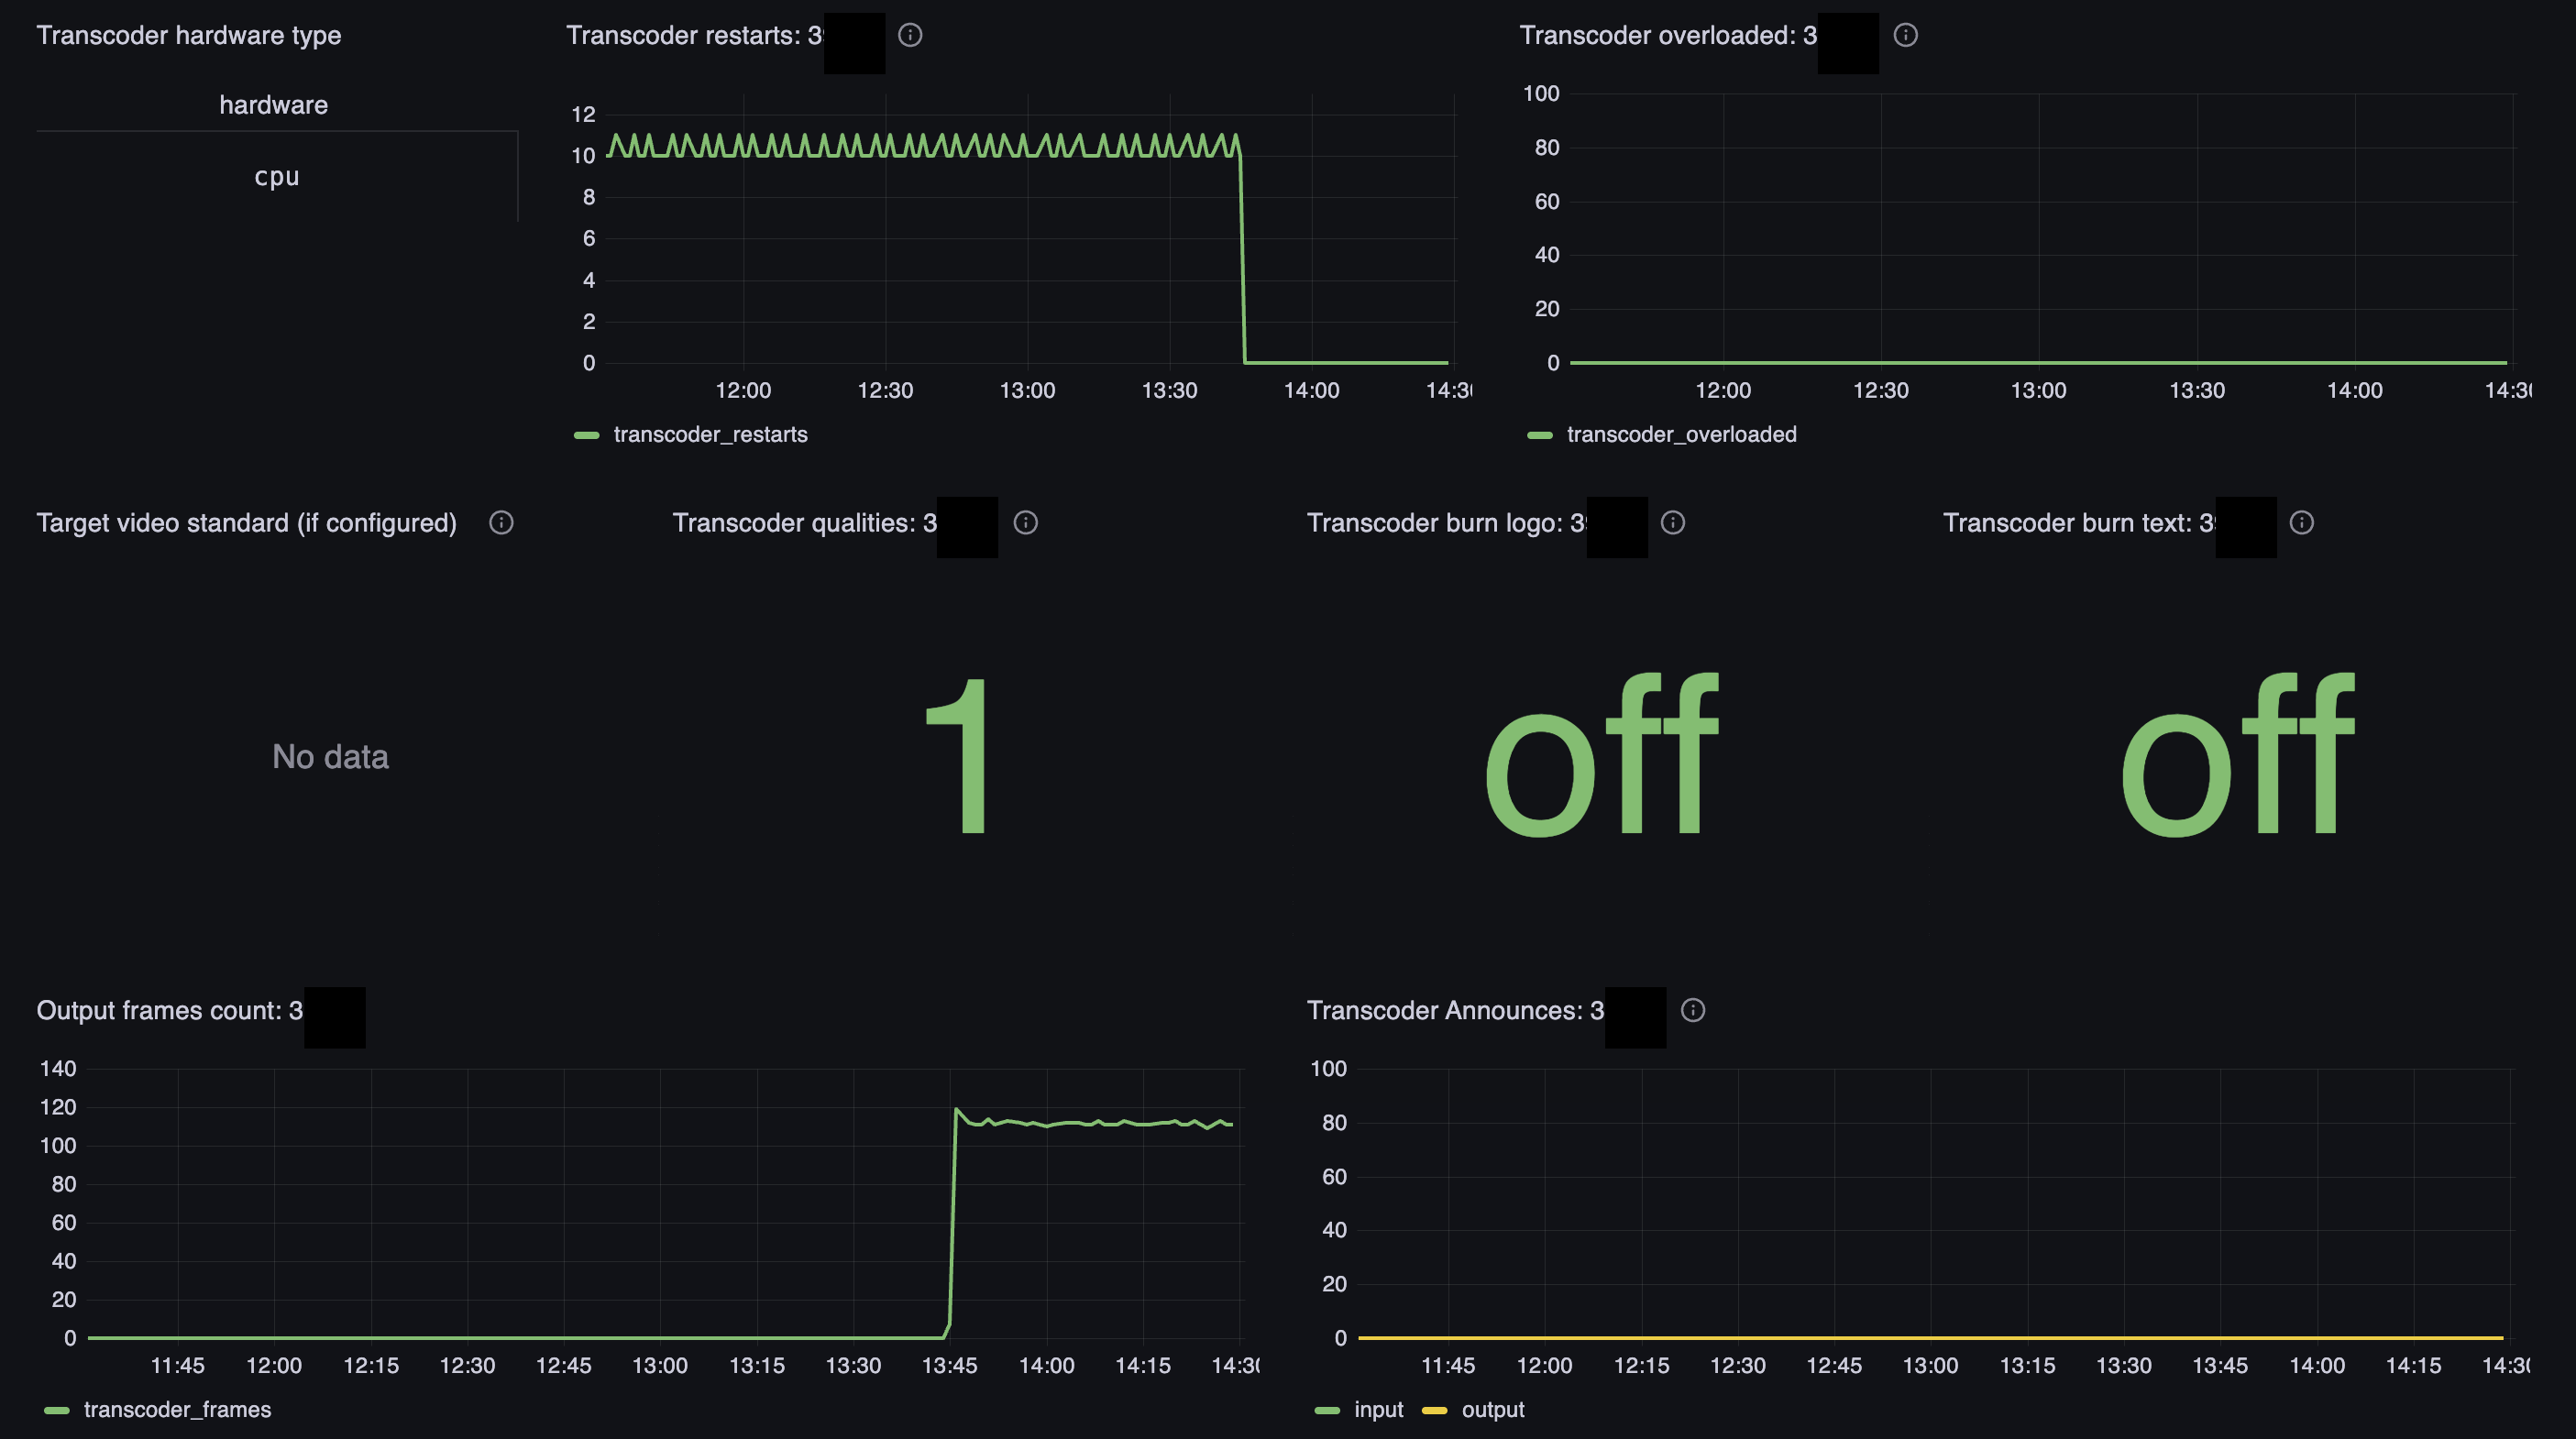
After selecting a stream, the Stream transcoder details group shows transcoder configuration and runtime metrics.
Hardware Acceleration
The Transcoder hardware table shows what the transcoder of the selected stream actually ran on:
- hw — what the stream is configured to transcode on;
- card — which card it ran on: a card number, CPU (no card at all), or n/a (a server of that version does not send the field, so it is unknown);
- fallbacks — how many times decoding fell back from the card to the CPU even though hardware acceleration was configured.
The last column is the reason this table was reworked. hw describes the setting, not the fact: a stream may be configured for a card while the codec was not taken by the card's decoder, or the card sat in quarantine, and decoding spent the whole hour on the processor. hw alone cannot show that; the pair "acceleration configured, yet fallbacks growing" shows it at a glance.
When investigating server load complaints, check whether streams slipped onto the processor in bulk: in the inventory that is the device column with the value CPU. For card problems — check its state on the Server Stats dashboard.
Restarts
The Transcoder restarts graph shows the number of transcoder restarts per interval (increase(transcoder_restarts)).
Normal is zero. Any growth means the transcoder periodically crashes and comes back up. The screenshot shows a typical recovery pattern: a long period of frequent restarts, then the line drops to zero — the transcoder stabilized (source fixed, load reduced, or stream restarted manually).
Correlate spike times with input errors for the same stream and with the Video frames in / out graph below — if there are restarts but no frames, the transcoder is not producing output.
Overload
The Transcoder overloaded graph is an overload indicator (transcoder_overloaded).
A non-zero value means the transcoder could not process input in real time. This precedes restarts and quality degradation: frames are dropped, latency grows. Normal is zero across the entire interval. On growth — reduce the number of simultaneous transcodes on the server, lighten the profile (resolution, bitrate, number of qualities), or add GPU capacity.
Target Video Standard
The Target video standard (if configured) table shows which standard the transcoder is configured for (transcoder_target), when target is set in configuration.
An empty value or "No data" means no explicit target is specified. Useful when diagnosing international PAL/NTSC projects or verifying the stream is set to the required output format.
Number of Output Qualities
The Transcoder qualities panel shows how many output video tracks the transcoder produces (transcoder_qualities).
A value of 1 means a single quality (one profile). More than one means adaptive or multi-bitrate transcoding. Each additional quality multiplies CPU/GPU load; when the server is overloaded, consider reducing the number of qualities.
Logo and Text Burn-In
Two panels show whether burn-in options are enabled:
- Transcoder burn logo (
transcoder_burn_logo) — on / off, logo burned into the frame; - Transcoder burn text (
transcoder_burn_text) — on / off, subtitles or custom text (date, time) burned into the frame.
Both options increase transcoder load. With transcoder_overloaded and frequent restarts on a stream with on, check whether the overlay is too heavy.
Frames In and Out
The Video frames in / out graph shows frames per second on both sides of the transcoder:
- in — frames fed to the transcoder;
- out — frames it produced, summed over all qualities; with three qualities this line sits roughly three times above in, which is normal rather than an anomaly;
- audio_in, audio_out — the same for sound, counted apart from video.
This is the main indicator that the transcoder is actually working. Stable non-zero lines with zero restarts are normal. in growing while out stands still means encoding stalled even though input keeps arriving.
An empty graph on a live stream does not mean "no frames" — it means "this server does not report the split": older versions count video and audio as one number and do not send the new fields. Check the server version before looking for a problem in the stream.
Announces
The Transcoder Announces graph shows input and output transcoder announces (transcoder_announces by input / output type).
Announces reflect stream parameter changes: new resolution, codec, track structure. Growth in input without output may mean the transcoder received new input parameters but has not yet started stable output. Simultaneous input and output spikes are a normal reaction to a source change. A prolonged zero on both lines with a working transcoder means input and output are stable.
Use Cases:
- Transcoded version "stuck": check Video frames in / out and Transcoder restarts — if there are no frames, look at input and overload
- Load grew after adding a second quality: compare Transcoder qualities with transcoder_overloaded and CPU/GPU graphs
- Mass restarts on the server without input issues: check total number of transcoded streams and the multiplexer — the server may be overloaded overall
- Complaint about missing logo: confirm Transcoder burn logo shows on for the relevant stream
Transcoding Cost
The collapsed Transcoder cost group answers "what does this stream cost, and why so much". Expand it after selecting a stream.
Cost by Stage
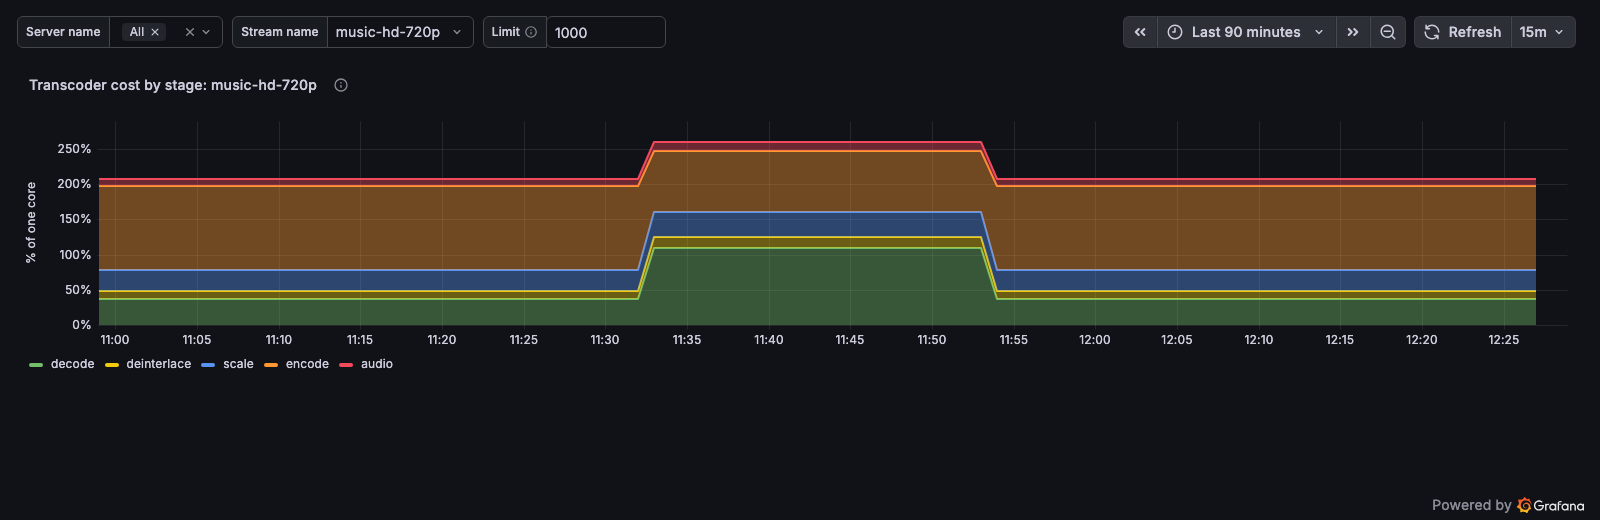
The Transcoder cost by stage graph shows how much CPU each pipeline stage eats, in percent of one core. The values add up: 230 % means 2.3 cores.
The breakdown answers "where does the processor time go", not "what is broken". On software transcoding the most expensive stage is encode, and that is normal rather than a finding. The breakdown is more interesting on a stream configured for a graphics card: there an expensive decode or scale means work the card should have done is being computed on the processor.
There are five stages:
- decode — decoding. If the stream is configured for hardware acceleration and this stage is expensive, decoding fell back to the processor; cross-check the fallbacks column in the Transcoder hardware table;
- deinterlace — deinterlacing. An honest zero on progressive input or with the filter off;
- scale — scaling. Expensive when resizing runs in software instead of on the card;
- encode — encoding. Grows with a heavy preset and with the number of output qualities;
- audio — sound. Grows with the number of tracks and with resampling.
A stage cheaper than one percent of a core rounds down to zero.
Overall Load
The Transcoder load graph shows what the transcoder costs as a whole, in the same percent of one core.
It sits next to the breakdown on purpose: the server reports total busy time as the sum of the five stages, so this line should match the top of the stack. A gap larger than a few points means the server sent an incomplete set of fields.
Output Stalls
The Output stalls graph shows the milliseconds the transcoder spent not moving frames:
- output_blocked — finished frames had nowhere to go. Low fps together with a low load and this line growing means the bottleneck is downstream, not in the transcoder;
- hold — the output was never built because the input description was incomplete. This differs from "the source went quiet": there the lag grows while this line stays flat.
Picture Quality
The collapsed Picture quality group is for complaints about broken picture, artifacts, and stuttering.
Corrupted GOP Share
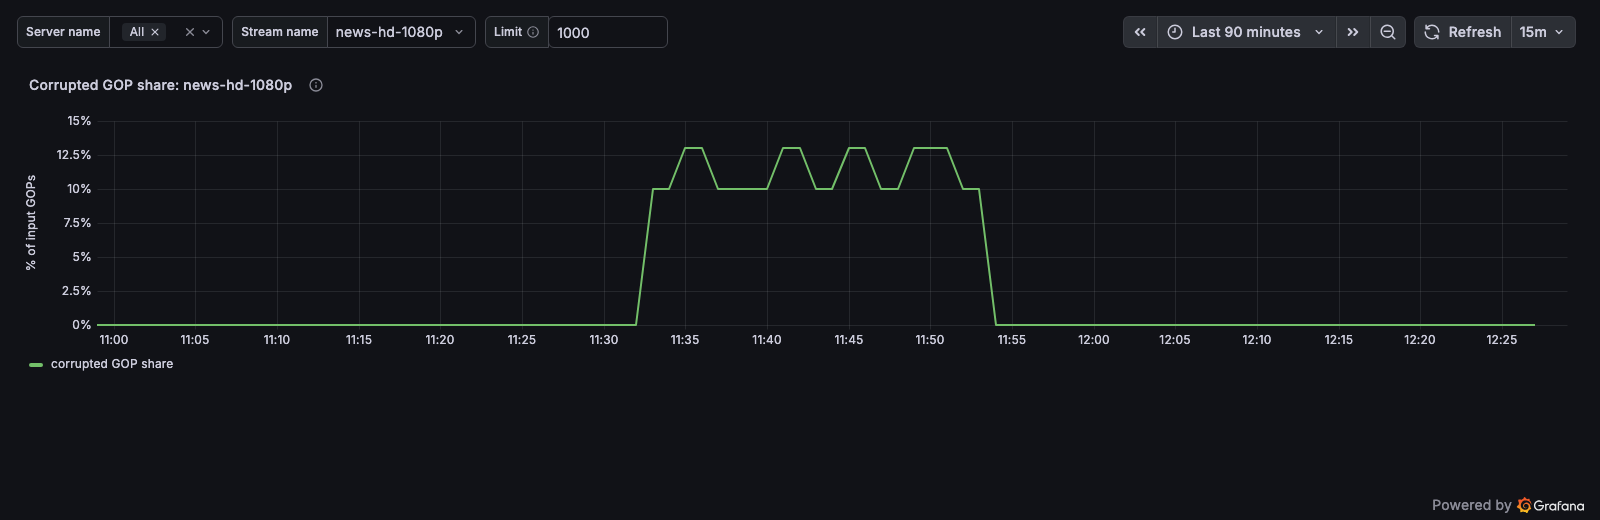
The Corrupted GOP share graph shows the share of frame groups that held at least one damaged picture. This is the closest thing to answering "how much screen time ran with artifacts".
A gap in the line means the stream fed no GOPs into the transcoder over that interval: there is simply no share, and that is not the same as "no artifacts".
Over a week the bucket grows into hours and the share flattens toward zero — at that range read the counters on the graph next to it.
Frame Loss
The Frame loss graph shows damaged and lost frames per second:
- concealed — the decoder rebuilt the picture from damaged input, so the frame reached the output with artifacts;
- dropped — the input frame produced nothing at the output.
These are counters, not shares: against fifteen hundred frames a minute, seven reconstructed ones are less than half a percent, and a quantity that small does not read as a share. "Seven defective frames a minute" also names directly how many pictures were affected.
Decoder Resets
The Decoder resets graph shows video decoder restarts, one per recovery episode rather than one per damaged frame.
Read it together with Frame loss: resets without concealed frames mean the decoder recovered cleanly; resets alongside them mean the recovery cost pictures.
Do not add these to the audio decoder resets in the Audio group: that counter ticks on every damaged packet, which is a different unit.
Output Integrity
The collapsed Output integrity group is for complaints that the stream breaks up, freezes, or falls behind.
Output Breaks
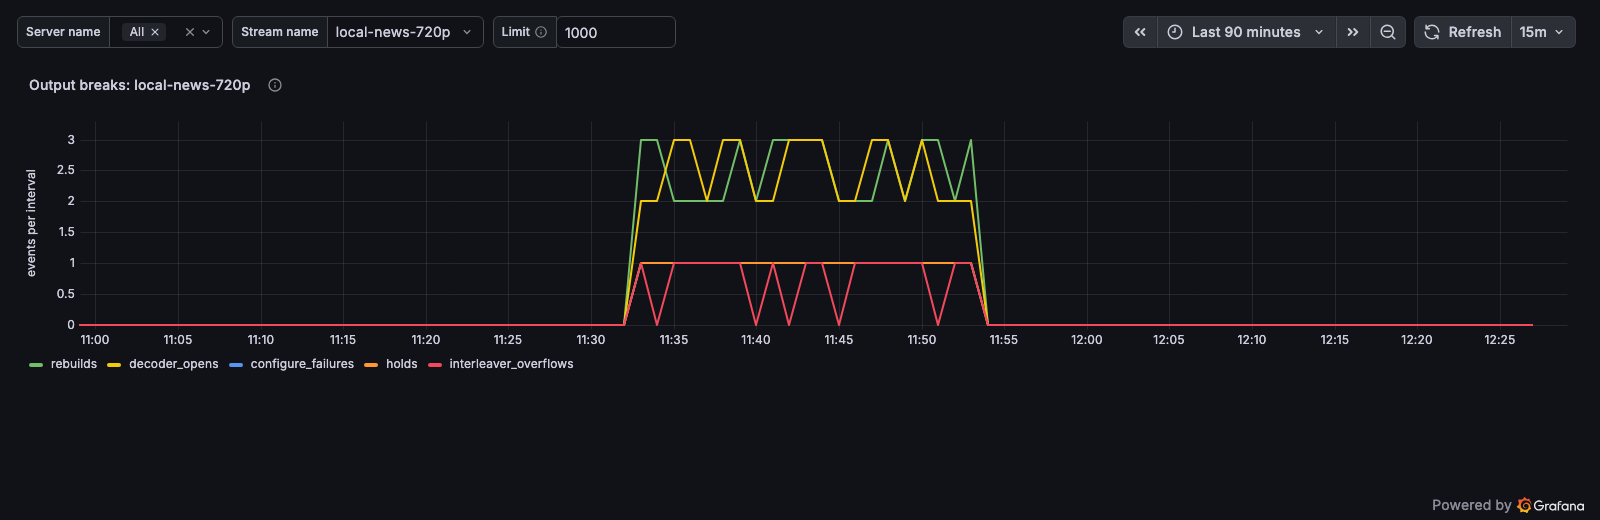
The Output breaks graph shows the episodes that break the output, per interval:
- rebuilds — the output was rebuilt: an operator changed the settings, there was a seam on the input, or this is a retry after a failed build. Each episode is a break in the output;
- decoder_opens — a rebuild that also required opening a new video decoder; growing together with rebuilds means the seams cost frames;
- configure_failures — a failed output build or settings application. Growing together with dropped frames means there is no output until the input or the settings change; growing alone means the failure was caught before the previous output was torn down, and it keeps running;
- holds — episodes of waiting for a complete input description: the output is not built and frames pile up in the start buffer;
- interleaver_overflows — a forced flush of the output reorder buffer: one of the tracks stopped arriving and the buffer hit its ceiling. Until the flush the whole output stalls, so the viewer sees a long freeze.
Output Lag
The Output lag graph shows how far the output trailed real time, the worst value in each interval.
The worst rather than the average: the lag is read at the moment a report closes, and over an hour what matters is how bad it got.
It grows when the source stalls or when the transcoder cannot keep up. Transcoder load and Output stalls from the cost group tell the two apart: with a resource shortage the load is high; with a bottleneck downstream it is low while output_blocked grows.
Audio
The collapsed Audio group is for sound complaints. The audio path is counted apart from video on every panel because there are several times more audio frames: a shared denominator would tie the loss share to the number of audio tracks, and a multilingual stream would look healthier than a mono one at the same quality.
Audio Frames In and Out
The Audio frames in / out graph shows audio frames per second on both sides of the transcoder.
Audio Frame Loss
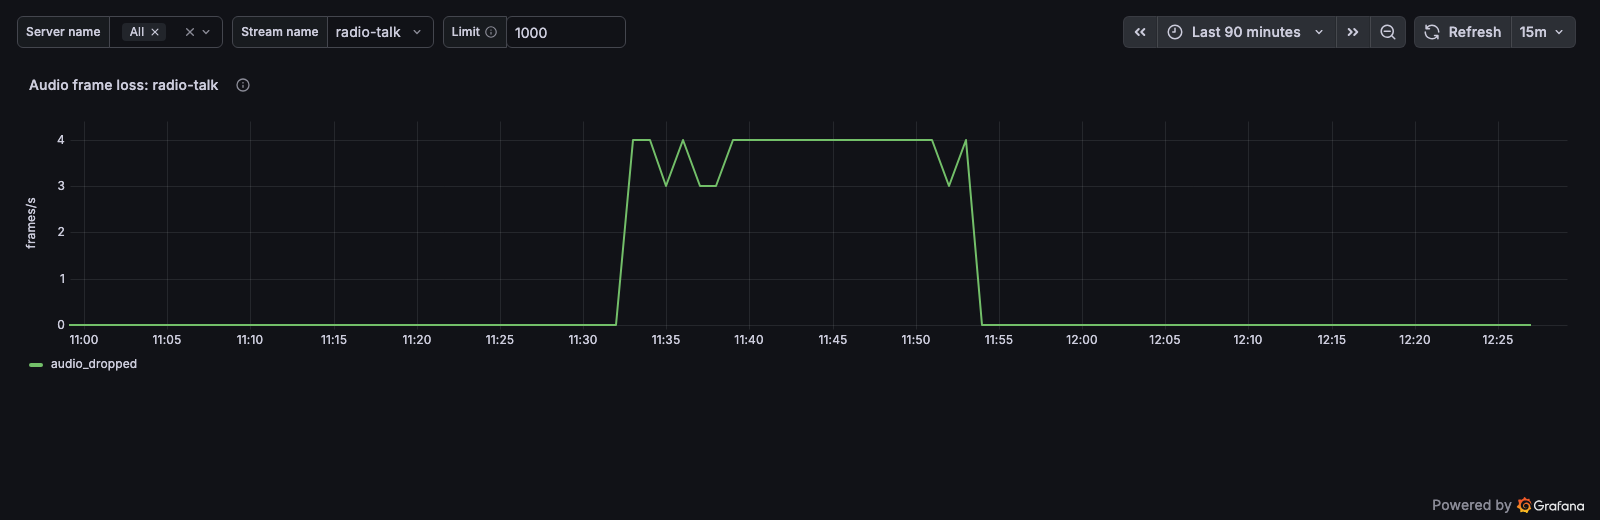
The Audio frame loss graph shows input audio frames that produced nothing at the output, per second.
Read it against Audio frames in / out: loss with input still flowing points at the audio path; loss together with a collapsed input means the source stopped sending that track.
Audio Decoder Resets
The Audio decoder resets graph shows audio decoder resets, one per damaged packet.
A large number here is normal on lossy input and does not by itself mean the sound is broken — read it together with Audio frame loss.