Input Monitoring
The Input Monitoring dashboard is one of the most important in the entire Retroview service, as it determines everything that will happen to the signal later.
Based on our 15 years of experience, most video processing issues resolve themselves if you fix the input problems. A huge part of our complex code is written around handling input problems that cannot be fixed.
Problem Stream Indication
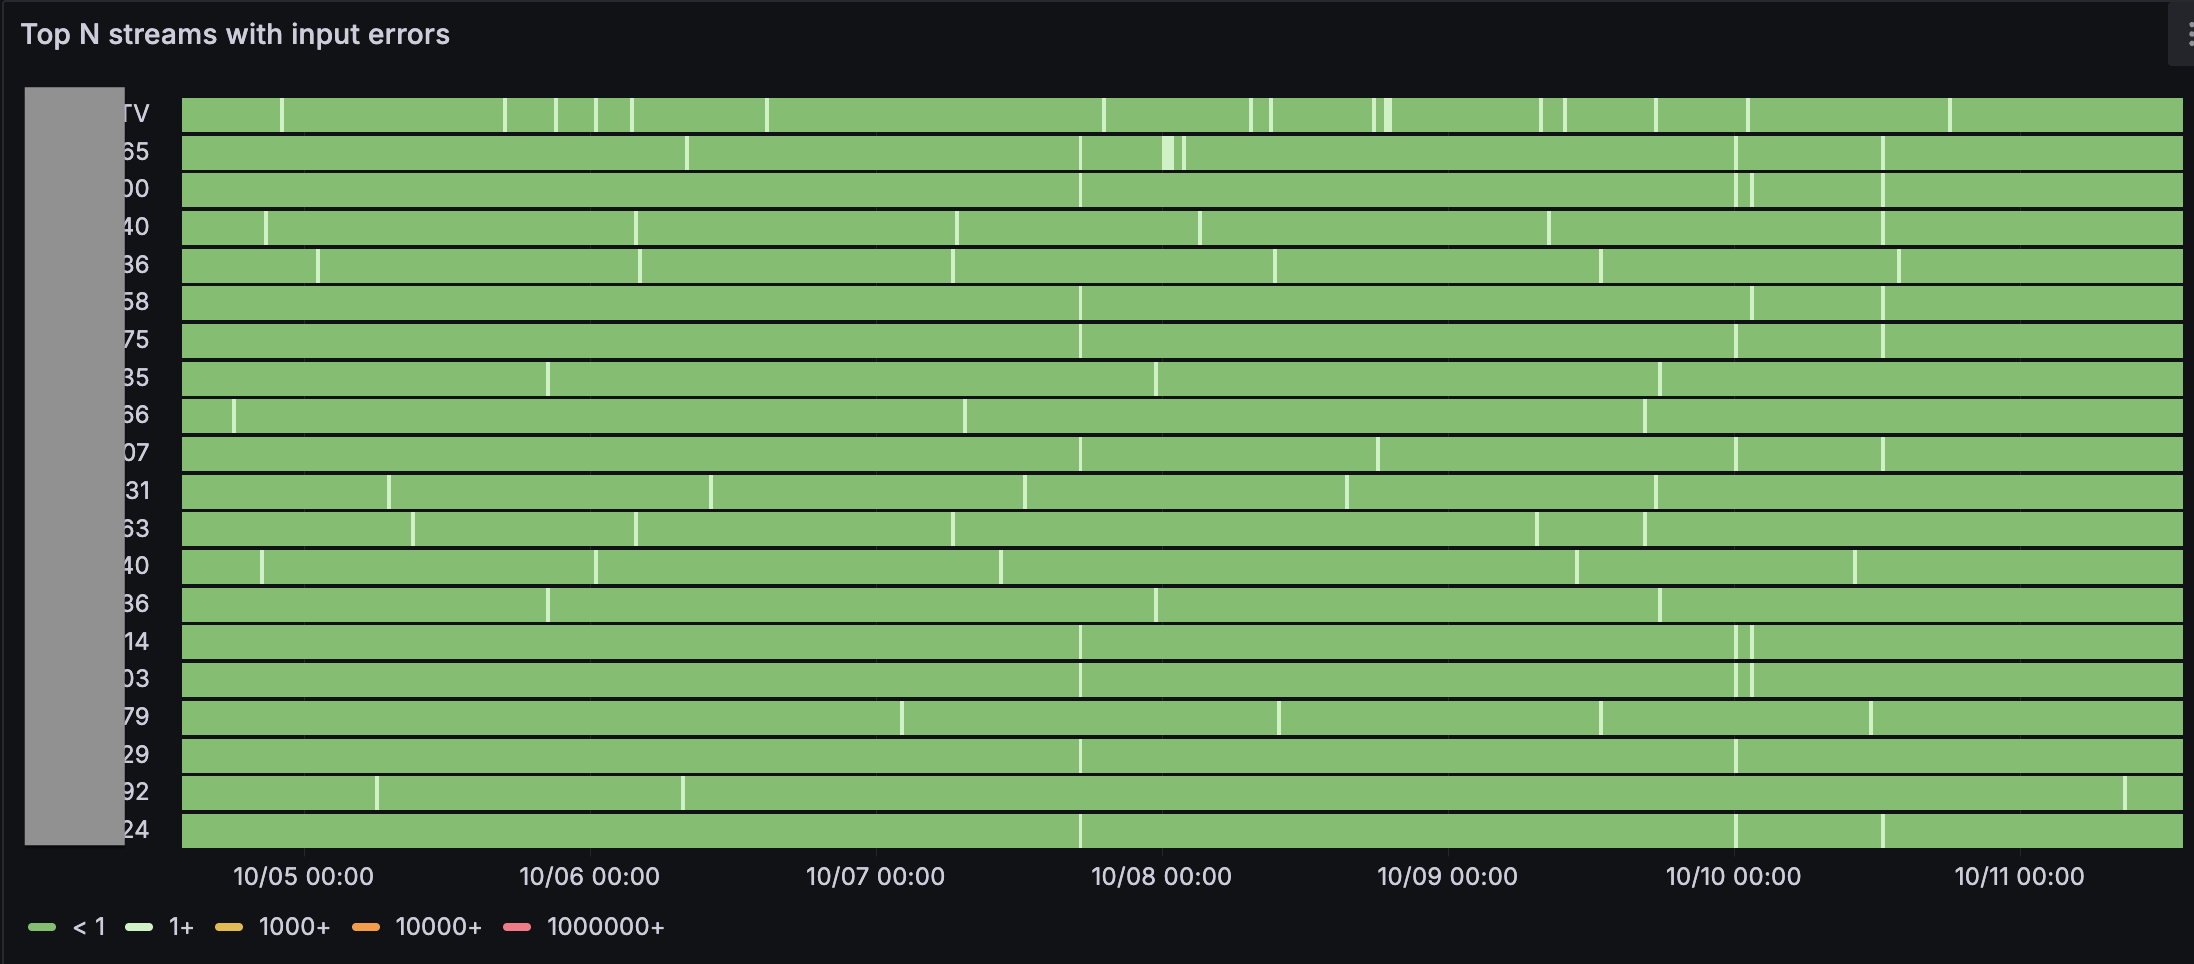
This is the most important graph for monitoring input status. From all streams in your service (from units to hundreds of thousands), the most problematic ones are displayed here. You can then select from the top and analyze details.
It's important to use different time ranges: small ones to see recent issues, and many days to see daily periodicity.
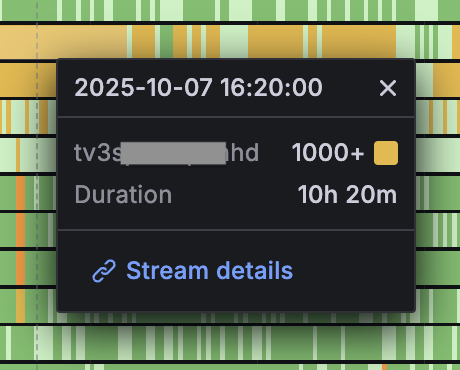
After getting the initial picture, you need to select a specific stream and study the situation on it:
What Evening Internet Peak Looks Like
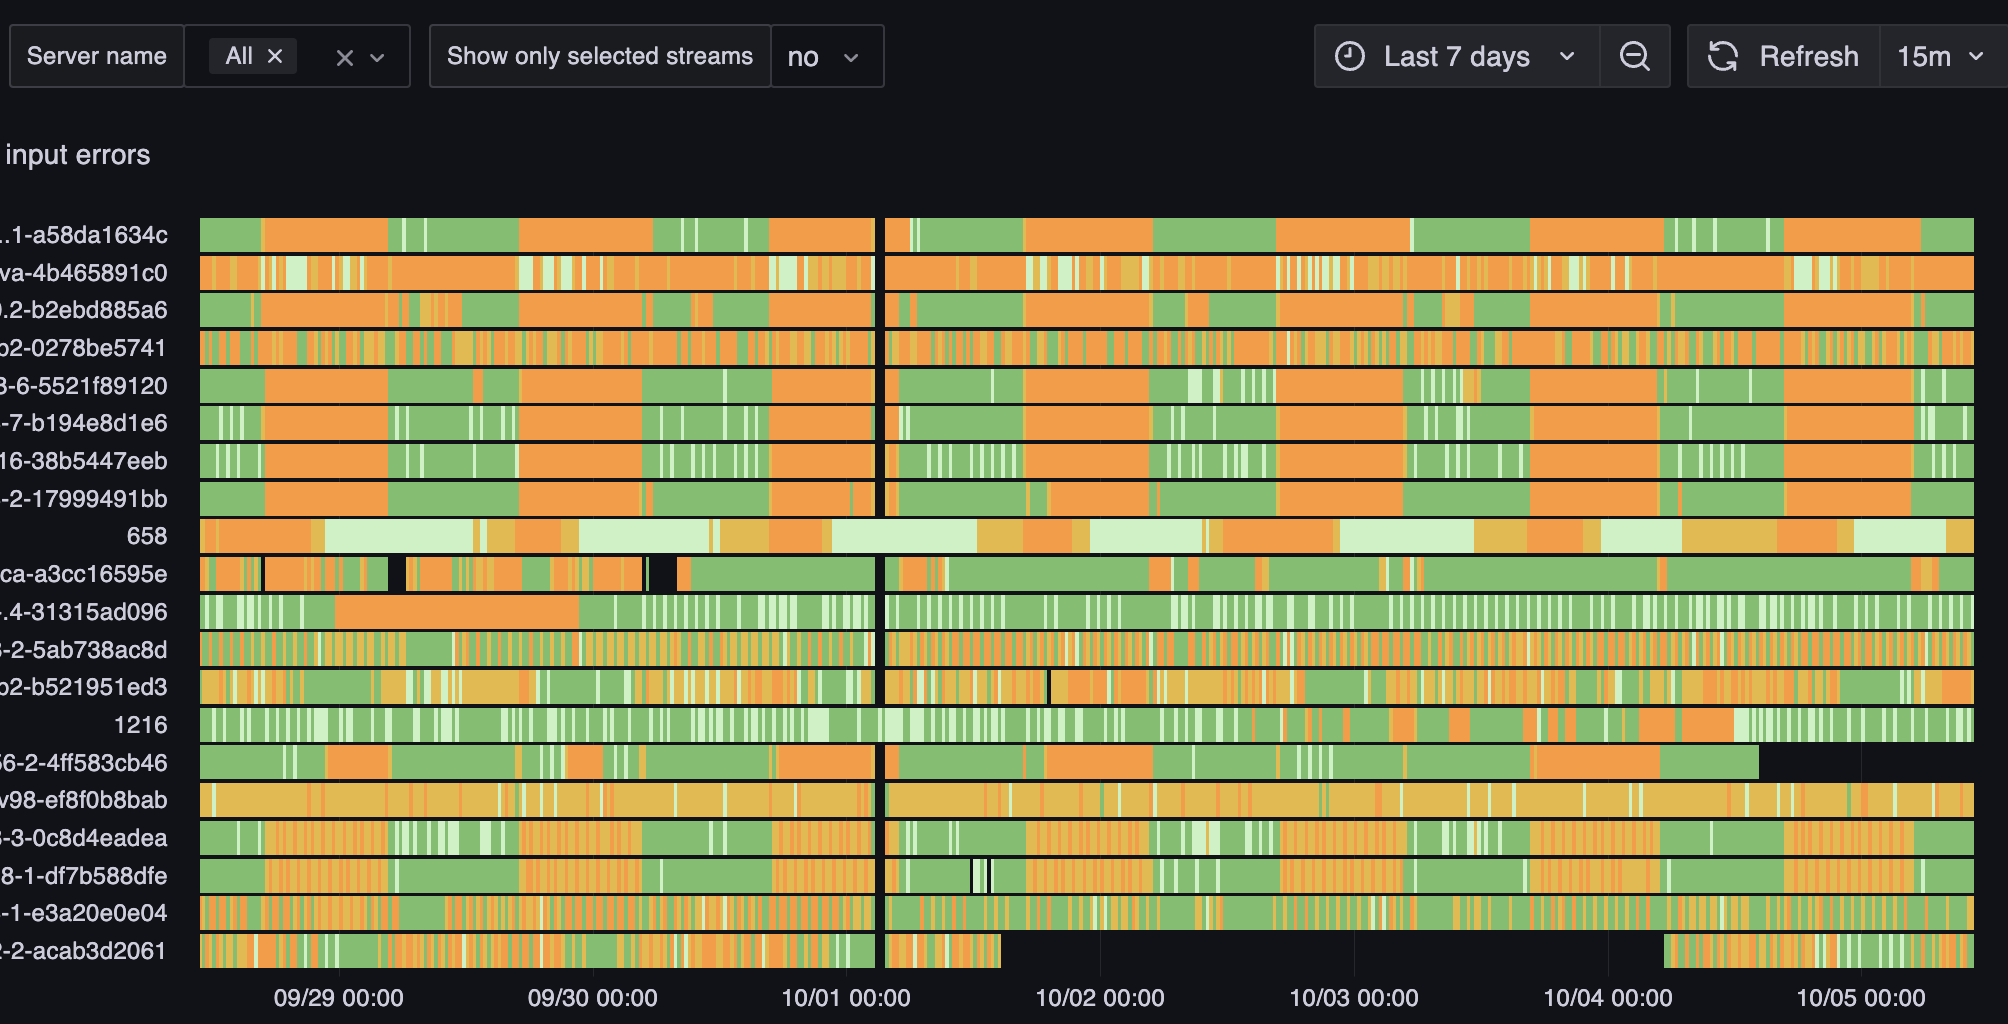
On such a graph we can see that every evening approximately from 7 PM to 1 AM there are reception problems. The reason is very simple: traffic from the source goes through the same network as serving this internet provider's users, so their evening internet consumption leads to packet losses from surveillance cameras.
The solution is simple: separate the network either physically or through VLAN, QoS, and other approaches.
Episodic Network Failures
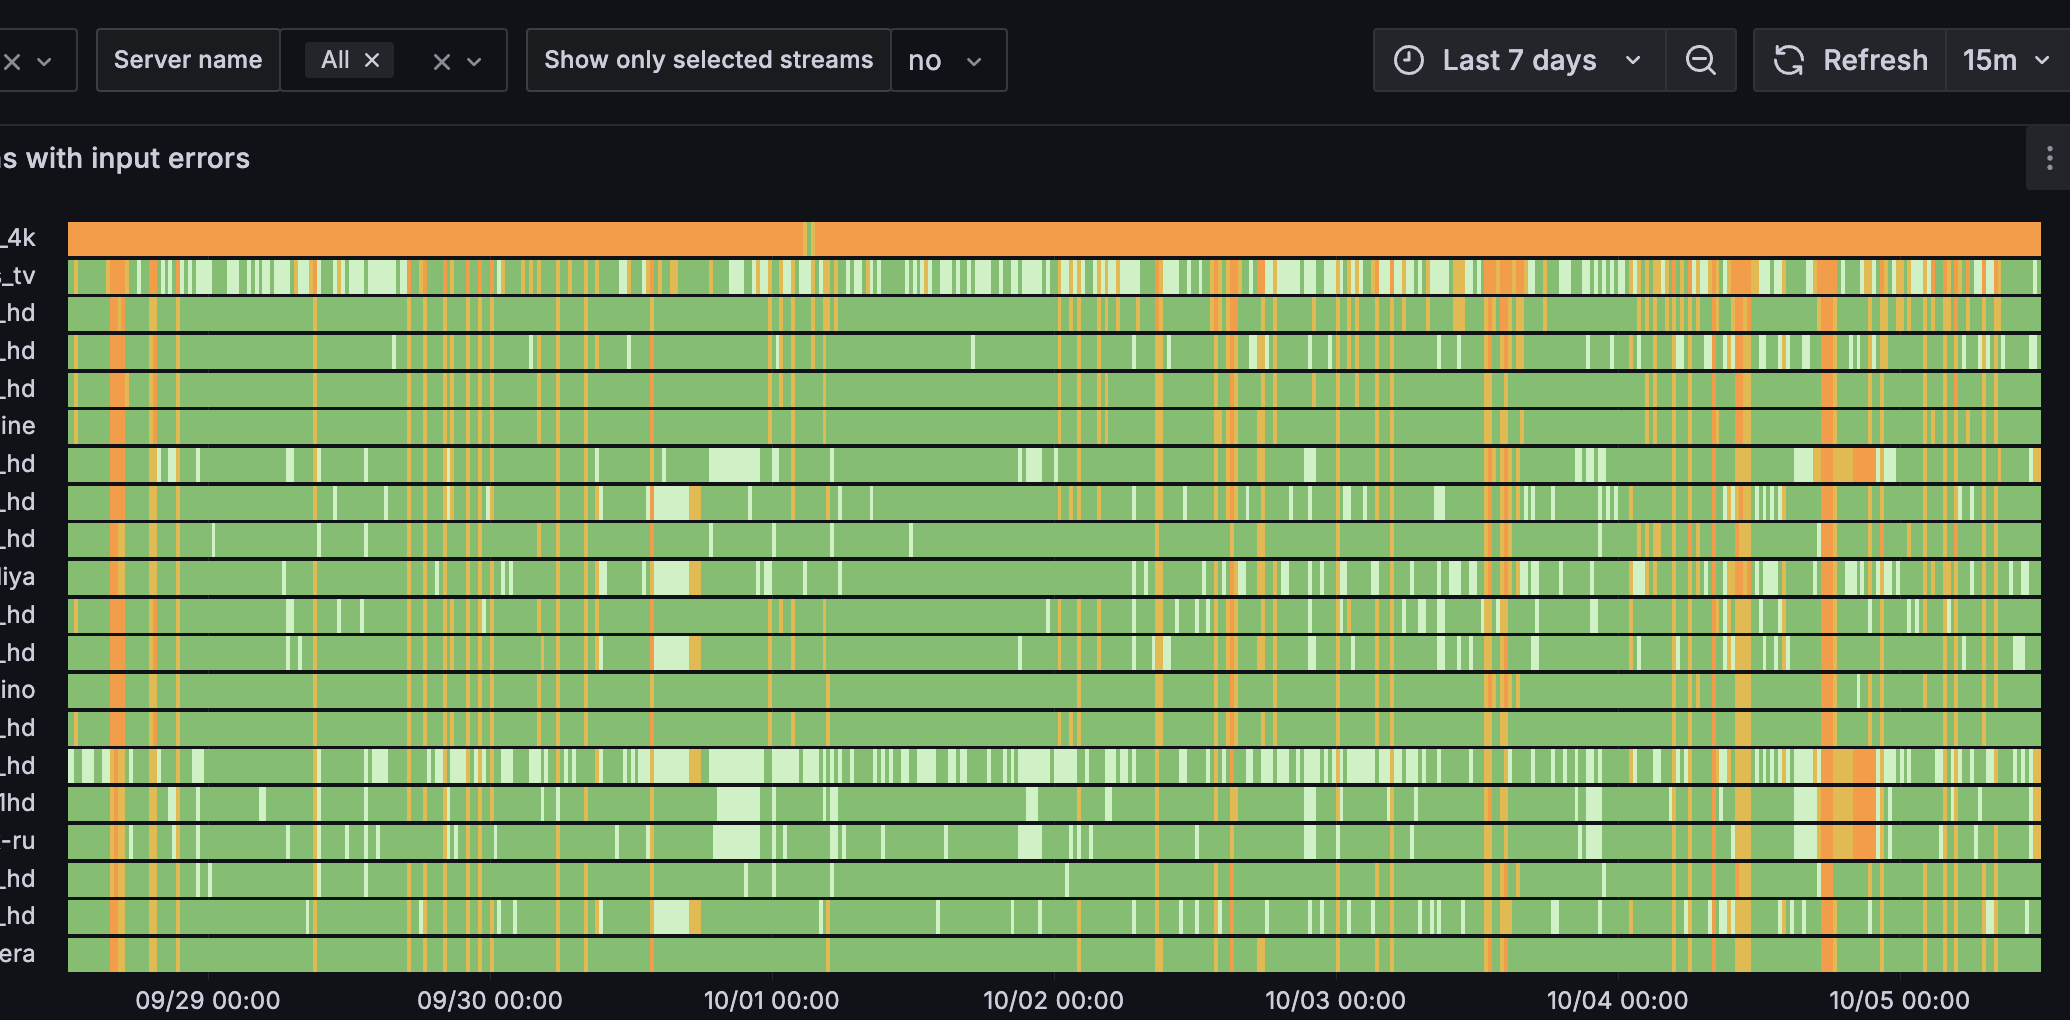
This is what periodic network bandwidth failures look like. Characterized by simultaneous error growth on many channels at once. Most often you need to examine load indicators on switches and expand network capacity.
What Provider Failure Looks Like
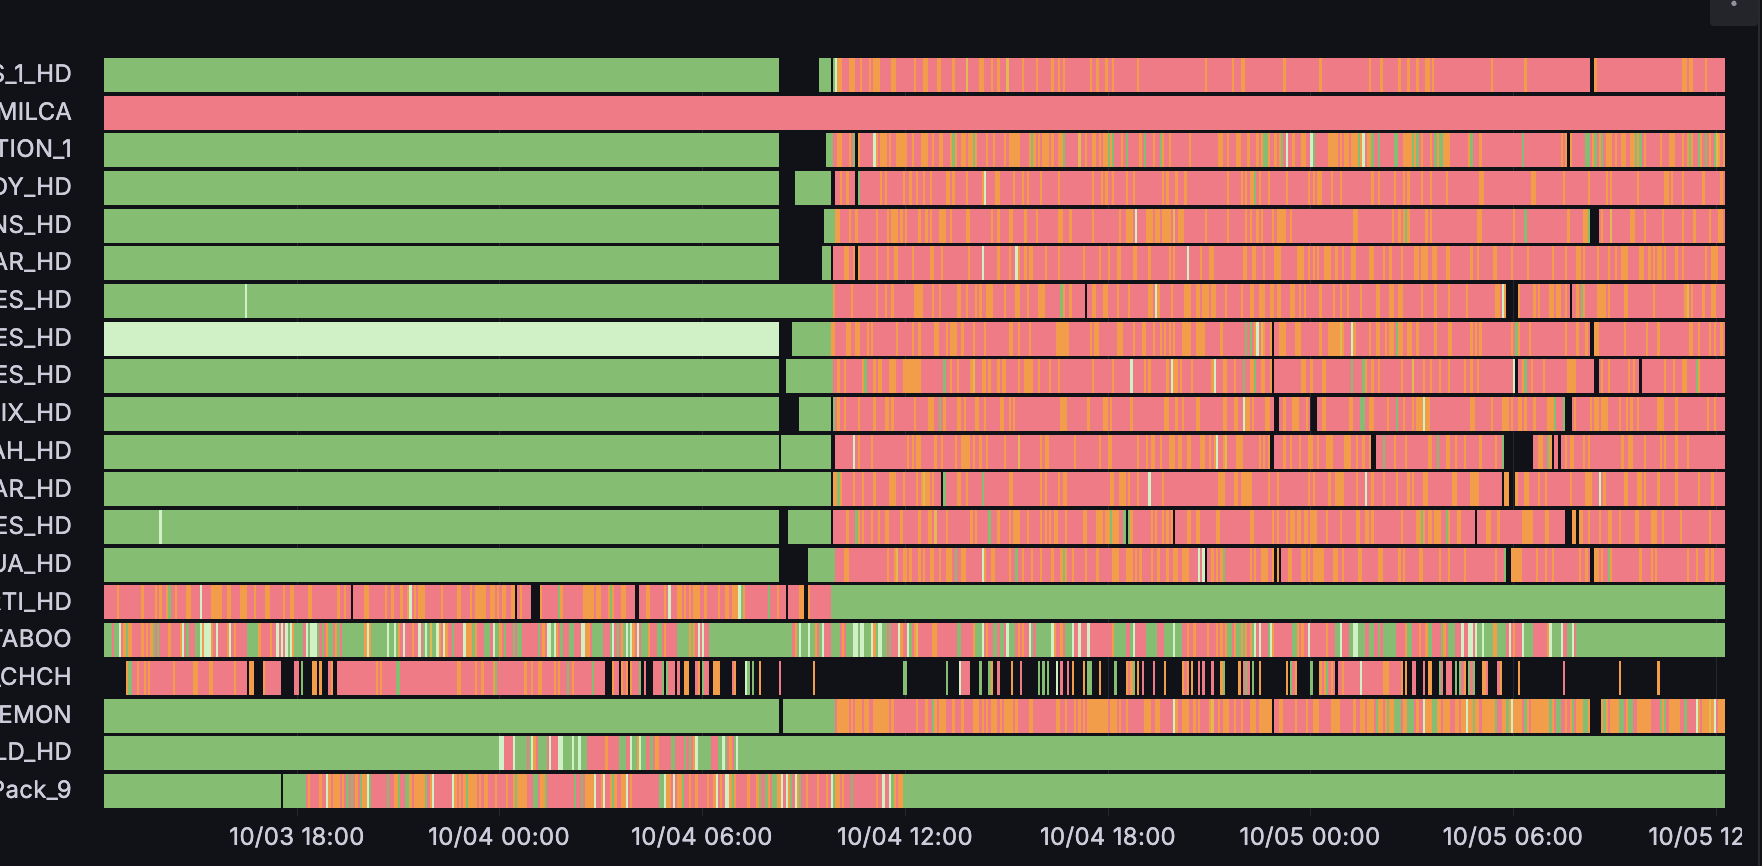
This is what a channel provider failure looks like, which needs to be fixed with a phone call. Everything was normal and suddenly broke. For example, this could happen if equipment broke or something happened with descrambling settings.
If subscribers aren't calling with this picture, perhaps you don't need these channels.
Set up alerts: To instantly know about mass problems, configure a mass stream failure alert. For critical channels, set up a specific stream failure alert to react before subscribers call.
Streams and Input Protocols
The Streams & input protocols section answers two questions the graphs do not: how exactly you receive video and which streams the account has at all. On the dashboard it sits above the problem stream graph, right below input bitrate and input availability.
The section holds two tables — the input protocol summary and the stream list. Both respect the selected server and the current Grafana time range.
Input Protocol Summary
The Input protocols on server table shows how many streams arrive over each protocol, how many bytes they bring in and how many errors they collect. It is calculated over all streams of the account on the selected servers: the Limit variable does not apply to it, so a long tail of hundreds of cameras is not truncated and the answer to "how much RTSP do I have" is honest.
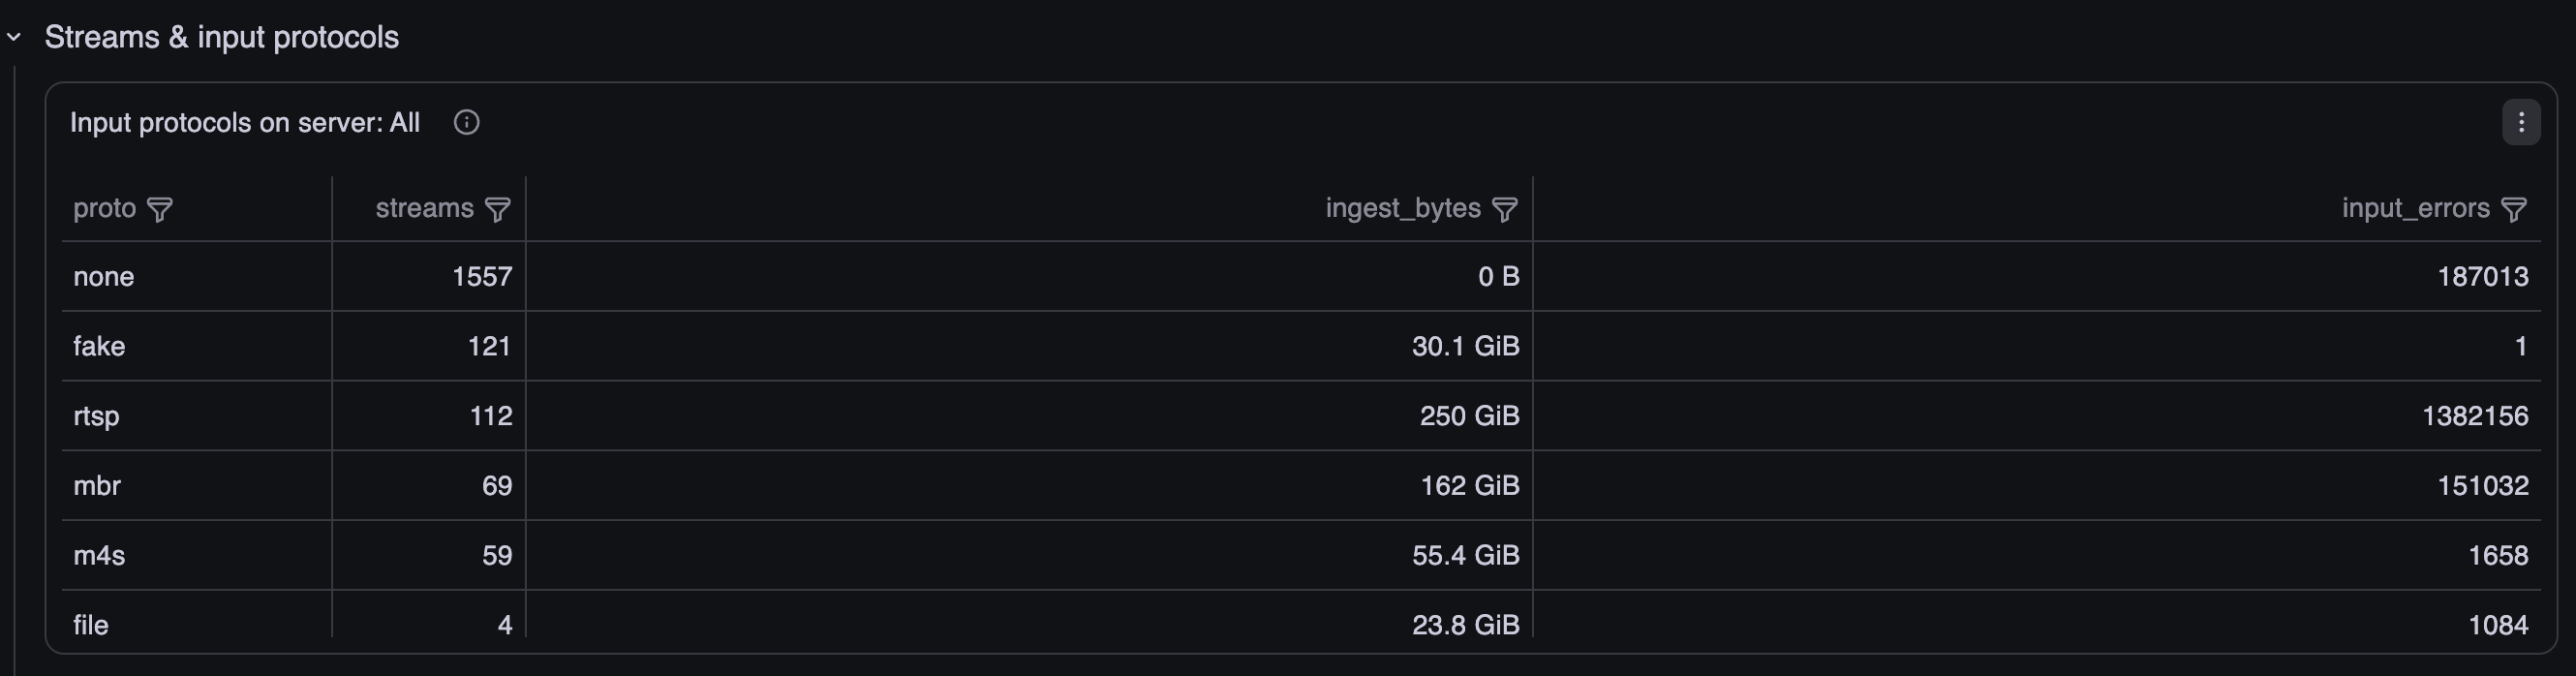
Columns:
- proto — input protocol: rtsp, rtmp, srt, udp, and other values you actually receive video over
- streams — how many streams are received over this protocol. Each stream is counted once, no matter how many times it reconnected during the interval
- ingest_bytes — total bytes received over this protocol during the interval
- input_errors — total number of input errors over this protocol
The sum of the streams column across all rows is the total number of account streams for the interval.
Stream List
The Streams on server table is a flat list of the account's streams ordered by received bytes: the heaviest inputs are on top.
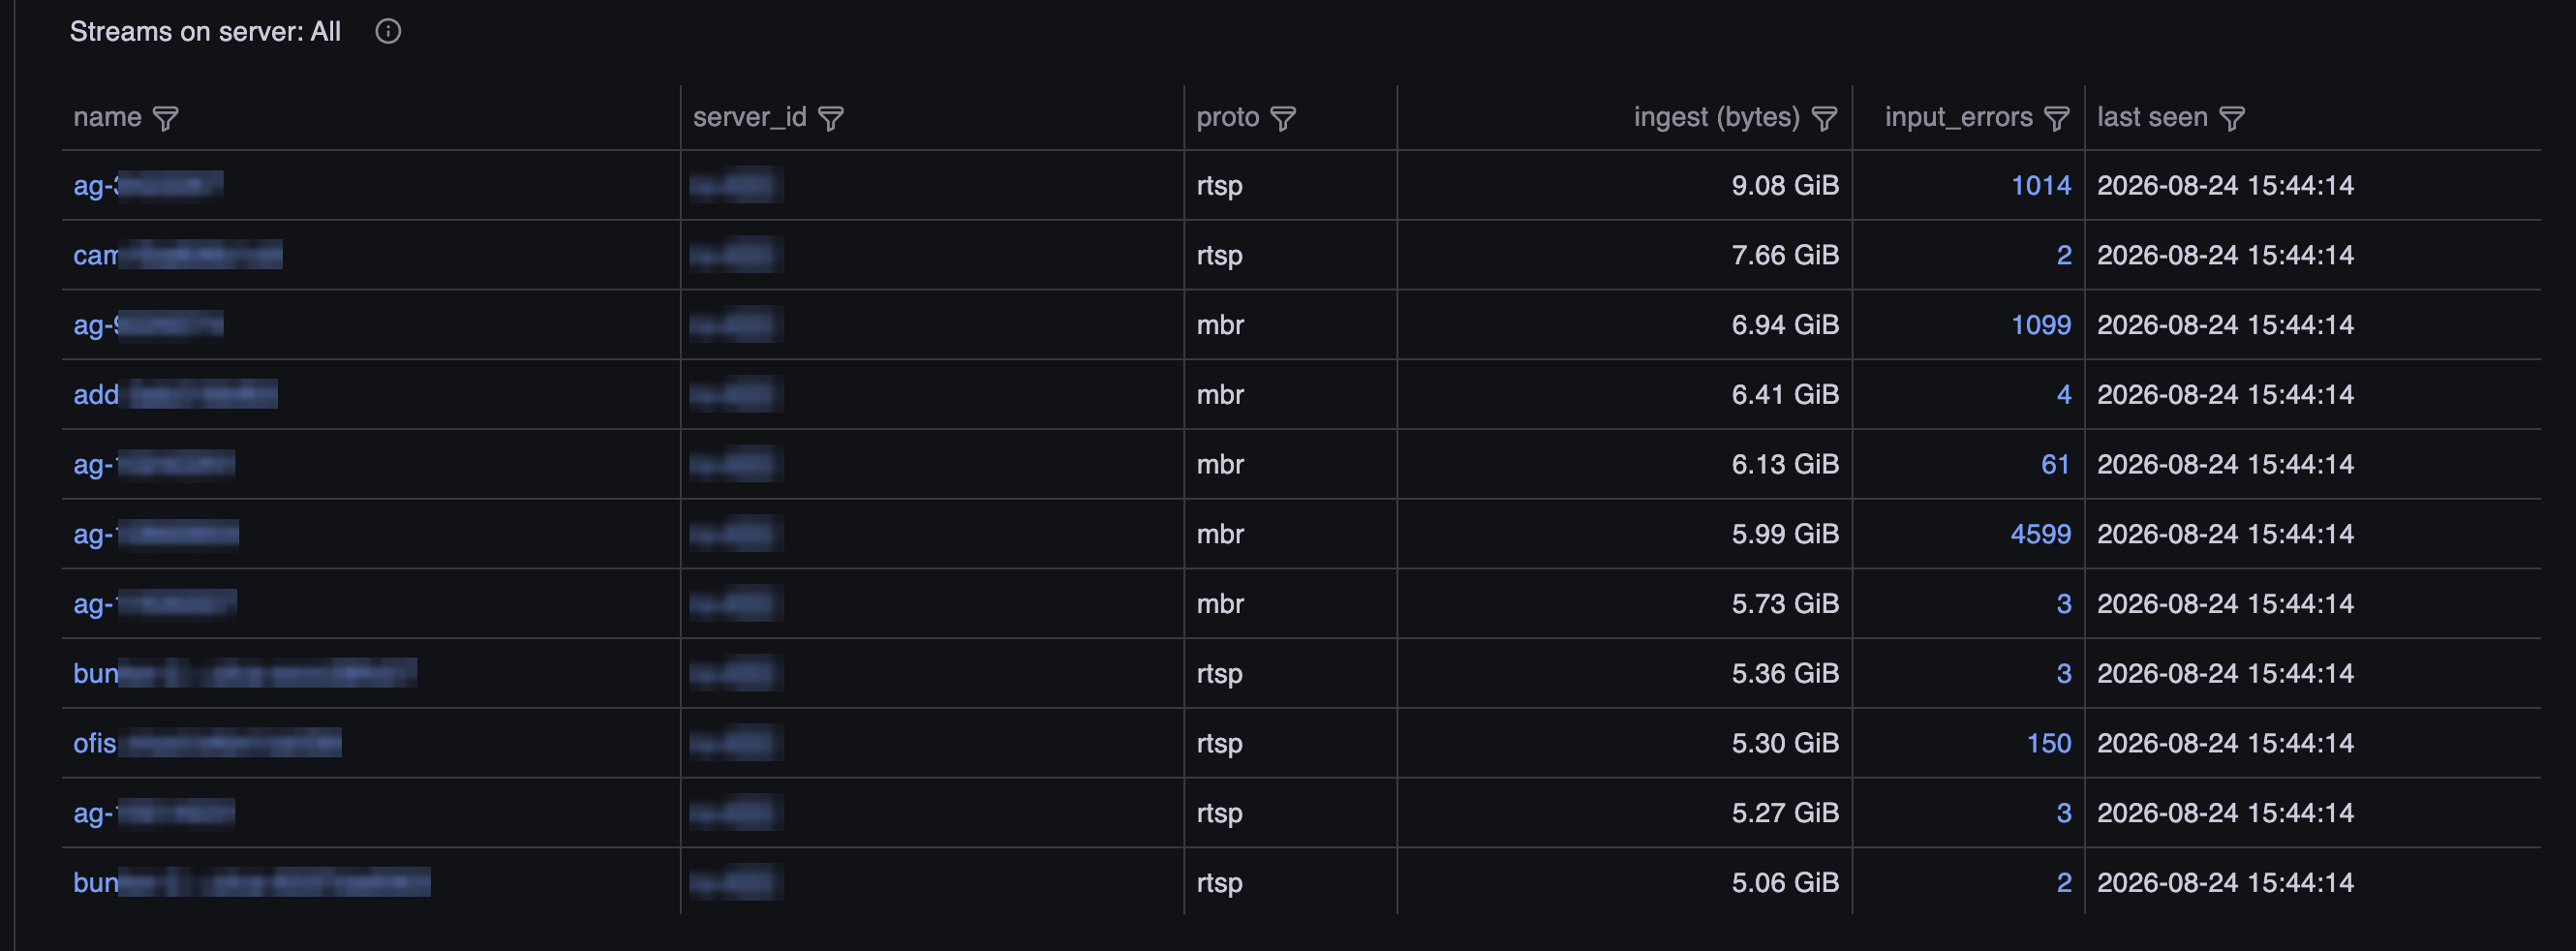
Columns:
- name — stream name
- server_id — the server the stream runs on. If several servers share a hostname, the value is shown as
hostname @ id - proto — input protocol
- status — stream state at the end of the interval: running, waiting, or error
- ingest (bytes) — bytes received during the interval
- input_errors — number of input errors during the interval
- last seen — the last minute of the interval when the stream was seen
Any column can be filtered right in the table header; most often you need it for proto and status — for example, to see SRT inputs only or streams in error only.
The number of rows is capped by the Limit variable at the top of the dashboard (default 1000, upper bound 50000): the table shows the first N streams by ingest volume. The protocol summary is calculated without that cap, so the sum of the streams column may be larger than the number of rows in the list.
If the account had no streams at all during the selected period, a No streams for the selected period row is shown instead of an empty table — this way an empty list is distinguishable from a broken query.
Drill-down
From the stream list you can drill into details without losing the selected interval:
- click name — input monitoring for that stream and its server
- click server_id — the Server stats dashboard for that server
- click input_errors — the same single stream view, approached from the "where do these errors come from" angle
The time range is carried over to the opened dashboard, so the details cover the same period as the table row.
Bitrate Breakdown by Protocol
The Bitrate breakdown switch at the top of the dashboard changes the split of the Total Input bitrate on server graph:
- version — by Flussonic version, the default split
- proto — by input protocol
The protocol split covers live input only (input_bytes) and excludes downloads from a remote archive (input_bytes_dvr) — this is visible from the input_bytes label in the legend.
Unlike the tables, the protocol here comes from the per-minute snapshot: the graph answers "which protocol carried these bytes at that moment", not "what is this stream's protocol overall".
How to Use It
Input inventory. Open the summary over a wide range and look at what your input consists of. This usually already reveals a couple of protocols nobody remembered were in use.
Migrating to another protocol. When moving sources, for example from RTMP to SRT, the summary shows progress: how many streams have already moved, while the bitrate breakdown by proto shows how the traffic flows over.
Where the errors actually are. Sort the summary by input_errors: if errors gather in one protocol, the cause is almost always shared — the network to sources of that type, settings, or equipment firmware, rather than one specific stream.
Configured but not working. The proto = none filter combined with status = error gives a list of streams that received no bytes at all during the period.
Heavy inputs. The top of the stream list holds the largest incoming bitrates. Useful before adding new channels to a server and when investigating network overload.
Single Stream Status
Below in the Stream details group there are several graphs: errors, traffic, warnings, dvr. They are all needed for systematic work with streams. We separated errors and warnings about problems so you can more easily distinguish critical issues from potential ones.
Stream Errors
The most important graph is errors. They should be at zero and this is achievable. Anything above zero is a problem that needs to be solved. In most cases, you can be confident that an error on the graph means picture breakup or loss of audio/subtitles, etc.
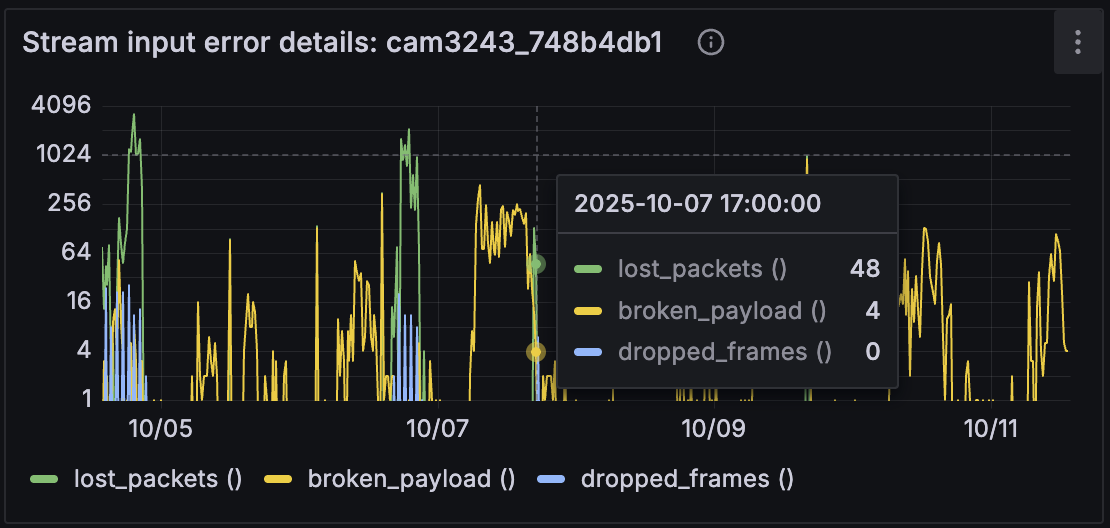
This is what a bad camera stream looks like, which needs to be improved by fixing the network between camera and media server.
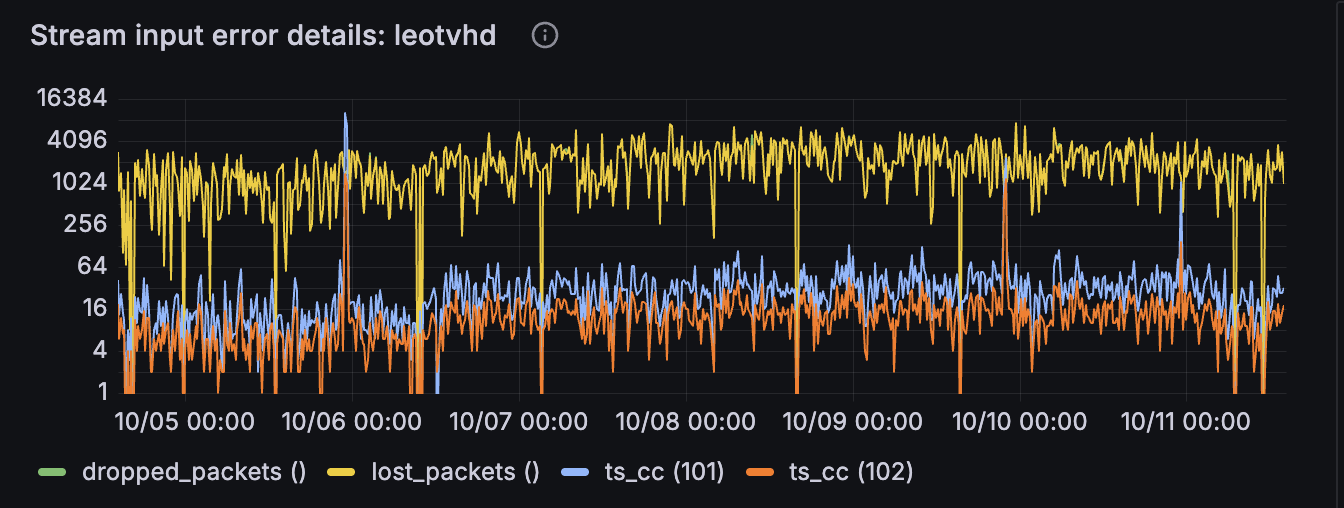
This is what SRT losses look like, which produce each other: packet loss leads to CC errors. Perhaps if you eliminate losses (i.e., channel bandwidth shortage), other errors will go away too.
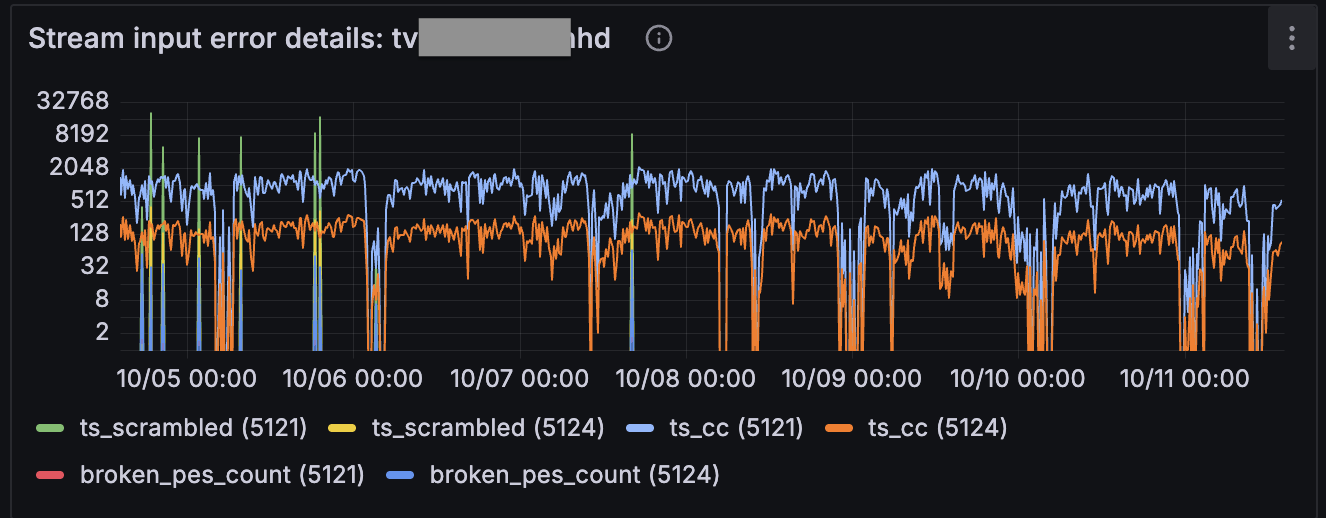
This is what TV signal reception with a large number of losses looks like. There's no point showing such video to clients, but in practice they often try to transcode it and ask for help with poor picture quality. You need to fix reception.
Set up alerts: Increase in bad streams alert will warn about quality degradation before subscribers start complaining about video artifacts. Unstable streams alert helps detect periodic network issues like evening peak or episodic failures.
Known Errors List
Below is a list of known errors that can be seen on the graphs.
- lost_packets - on SRT, RTSP, WebRTC, ST2110 protocols you can reliably count the number of lost packets. Fix network or increase channel bandwidth
- src_404 - number of times the source returned HTTP 404 (or other). Change or fix the source URL
- src_403 - 403 code on source, i.e., no authorization. Update the authorization key or credentials
- src_500 - error 500 on source. Fix the source urgently
- broken_payload - this error occurs on different protocols. For example, in SDI it means a broken frame; when unpacking RTP this counter can increase from broken H264/5 NAL-unit structure. If there are no packet losses but the counter is growing, the provider needs to fix the source
- dropped_frames - this can occur when capturing MPEG-TS stream, when one track is declared and disappears for a long time. The track reordering mechanism cannot wait for it and drops the entire accumulated queue. Contact the provider to fix the source
- dropped_packets - packets dropped for various reasons that are not always counted as lost_packets. Investigate network quality and source stability
- no_signal - frames dropped because the input reported no signal (for example, a black frame from a capture card or camera). Check the camera, cable, and source
- duplicate - frame data was duplicated from the previous frame because the input was too slow. Reduce server load or fix the slow source or network path
- ts_duplicate - frame timestamp is the same as the previous frame. Usually indicates a stuck or broken source clock. Fix the source or update camera firmware
- cpu_stall - frame dropped because CPU load on the server was too high. Reduce load or redistribute streams across servers
- ts_stuck_restarts - some cameras reach the maximum packet timecode value and then instead of resetting, start sending the maximum value. Fixed by reconnecting to the camera. Contact the camera manufacturer
- ts_jump_restarts - connection restarts triggered by a very long stream timestamp jump. Usually indicates broken timestamps on the source. Fix the source or update camera firmware
- desync - indication that the byte stream input lost the structure of packet start and end and it's necessary to drop bytes until synchronization reappears, i.e., clear frame structure. Fix the source or network path
- ts_pat - there was no PAT in the incoming MPEG-TS stream for a long time. Fix the source or antenna
- ts_pmt - there was no PMT in the incoming MPEG-TS stream for a long time. Specified separately by stream PIDs. Fix the source
- errors_pid_lost - MPEG-TS PID disappeared from the stream. Shown per PID on MPEG-TS graphs. Fix the source or investigate multiplexing
- ts_service_lost - how many times MPEG-TS PAT was received with programs that don't exist. Fix the source multiplexing
- adaptation_broken - how many times MPEG-TS adaptation field was invalid. As a rule, this error means complete garbage on input
- ts_scrambled - MPEG-TS stream is encrypted. Urgently figure out CAM modules
- ts_cc - incorrect MPEG-TS Continuity Counter, most likely packet loss. Fix network
- ts_tei - received MPEG-TS packet with error indication explicitly set by previous source. Deal with that source
- ts_psi_checksum - checksum mismatch in MPEG-TS packet service structures. Fix source or antenna
- broken_pes_count - PES packet inside MPEG-TS didn't start with startcode. Fix bad source
- discarded_buffer_count - how many times data in MPEG-TS was discarded because a frame couldn't be assembled from it. Fix source
- ts_crashed - internal error occurred in media server when processing MPEG-TS. Contact technical support
- too_large_dts_jump - time jump of more than 30 seconds occurred in MPEG-TS stream. This can occur, for example, because the source is formed from files that are rotated without time restamping. Another reason is mixing audio and video from different streams. If such errors are rare, playback violation may be only local, but in any case such stream should be fixed
- rtp_pt_reject - in RTSP (RTP) stream packets arrive with unknown, foreign Payload Type and have to be dropped. Demand camera firmware update
- dts_stuck - RTSP camera started returning the same timestamp. Replace camera or update firmware
- resync_count_jump - Source may change timestamps without any signalling. This counter indicates how bad is the source
- discarded_not_allowed_nal_count - unsupported H264 packetization type received, for example STAP-B or MTAP. Most likely update firmware or replace camera, but if you're confident this is what you need - contact support
- motion_detector_not_authorized - motion detector requests rejected due to authorization failure. Check ONVIF credentials and access settings on the camera
- motion_detector_url_unreachable - motion detector requests failed because of a bad URL or network issues. Check the configured URL, network path, and camera availability
- motion_detector_no_agent_connected - motion detector request failed because no Flussonic Agent is connected. Ensure the agent is running and connected to the streamer
- motion_detector_no_service - attempt to access a disabled or unsupported ONVIF motion detection service. Enable motion detection on the camera or check ONVIF compatibility
- motion_detector_incorrect_time_values - motion detector responses did not meet expected time or value conditions. Check camera firmware and motion detector configuration
- motion_detector_broken_payload - motion detector responses contained broken or invalid content. Check camera firmware; update if needed
- agent_conn_failed - the agent could not open the requested connection. May indicate problems opening the TCP socket on the agent or an unreachable remote host. Check the agent, network, and target host
- agent_out_of_memory - the agent ran out of memory while establishing a connection to the remote host. Reduce agent load or increase available memory
- agent_buffer_overrun - the agent buffer was too small for outgoing traffic. Increase buffer size or reduce traffic through the agent
- agent_invalid_request - the agent received invalid requests. Check stream configuration and agent version
- agent_unknown - unknown agent errors. Collect logs and contact technical support
- crashed - unhandled crash during input processing. Contact technical support
- errors_sr_clock_deviation - camera time significantly differs from streamer time. Occurs when the streamer receives RTCP synchronization and detects that camera clock deviation exceeds the allowed threshold. The counter increases only when the wait_rtcp option is enabled, meaning the streamer uses camera timestamps as is, without correction. Impact: serious archive issues, broken DVR timeline, and playback problems. What to do: urgently check and fix camera time (system clock, timezone, NTP). If IRIS-DVR archive replication is not required, disable the wait_rtcp option on the streamer. If the issue occurs while using IRIS-DVR, contact support
Stream Input Warning Details
Warnings that are corrected by the server:
- not_aligned_packets_udp_mpegts - UDP packets whose MPEG-TS payload length is not a multiple of 188 bytes. Usually indicates network corruption, wrong encapsulation, or equipment misconfiguration. Check the UDP path and source
- ts_stuck - TS stuck issue restarts
- sr_ts_stuck - SR packets with repeated RTP timestamp
- sender_clock_deviation - Sender clock ahead/behind server time
- ts_goes_backwards - Time jumped back on the channel
- ts_jump_forward - Time jumped forward
- no_marker_mode_flag - Decoder works in no marker mode
- fu_pattern_is_broken_count - Broken FU pattern
- fu_has_both_start_end_bits_count - FU with both Start and End bits set
- fu_end_then_middle_workaround_count - FU workaround applied
- dts_stuck - Repeated DTS
- dts_goes_backwards - DTS jumped back
- dts_jump_forward - DTS jumped forward
Set up alert: Increase in offline streams alert allows you to react to a growing problem before it affects a critical mass of channels.
DVR Recording Status
The "DVR recording issues" graph shows recording problems.
This doesn't directly relate to capture, but the data itself will become unusable if there are errors on this graph.
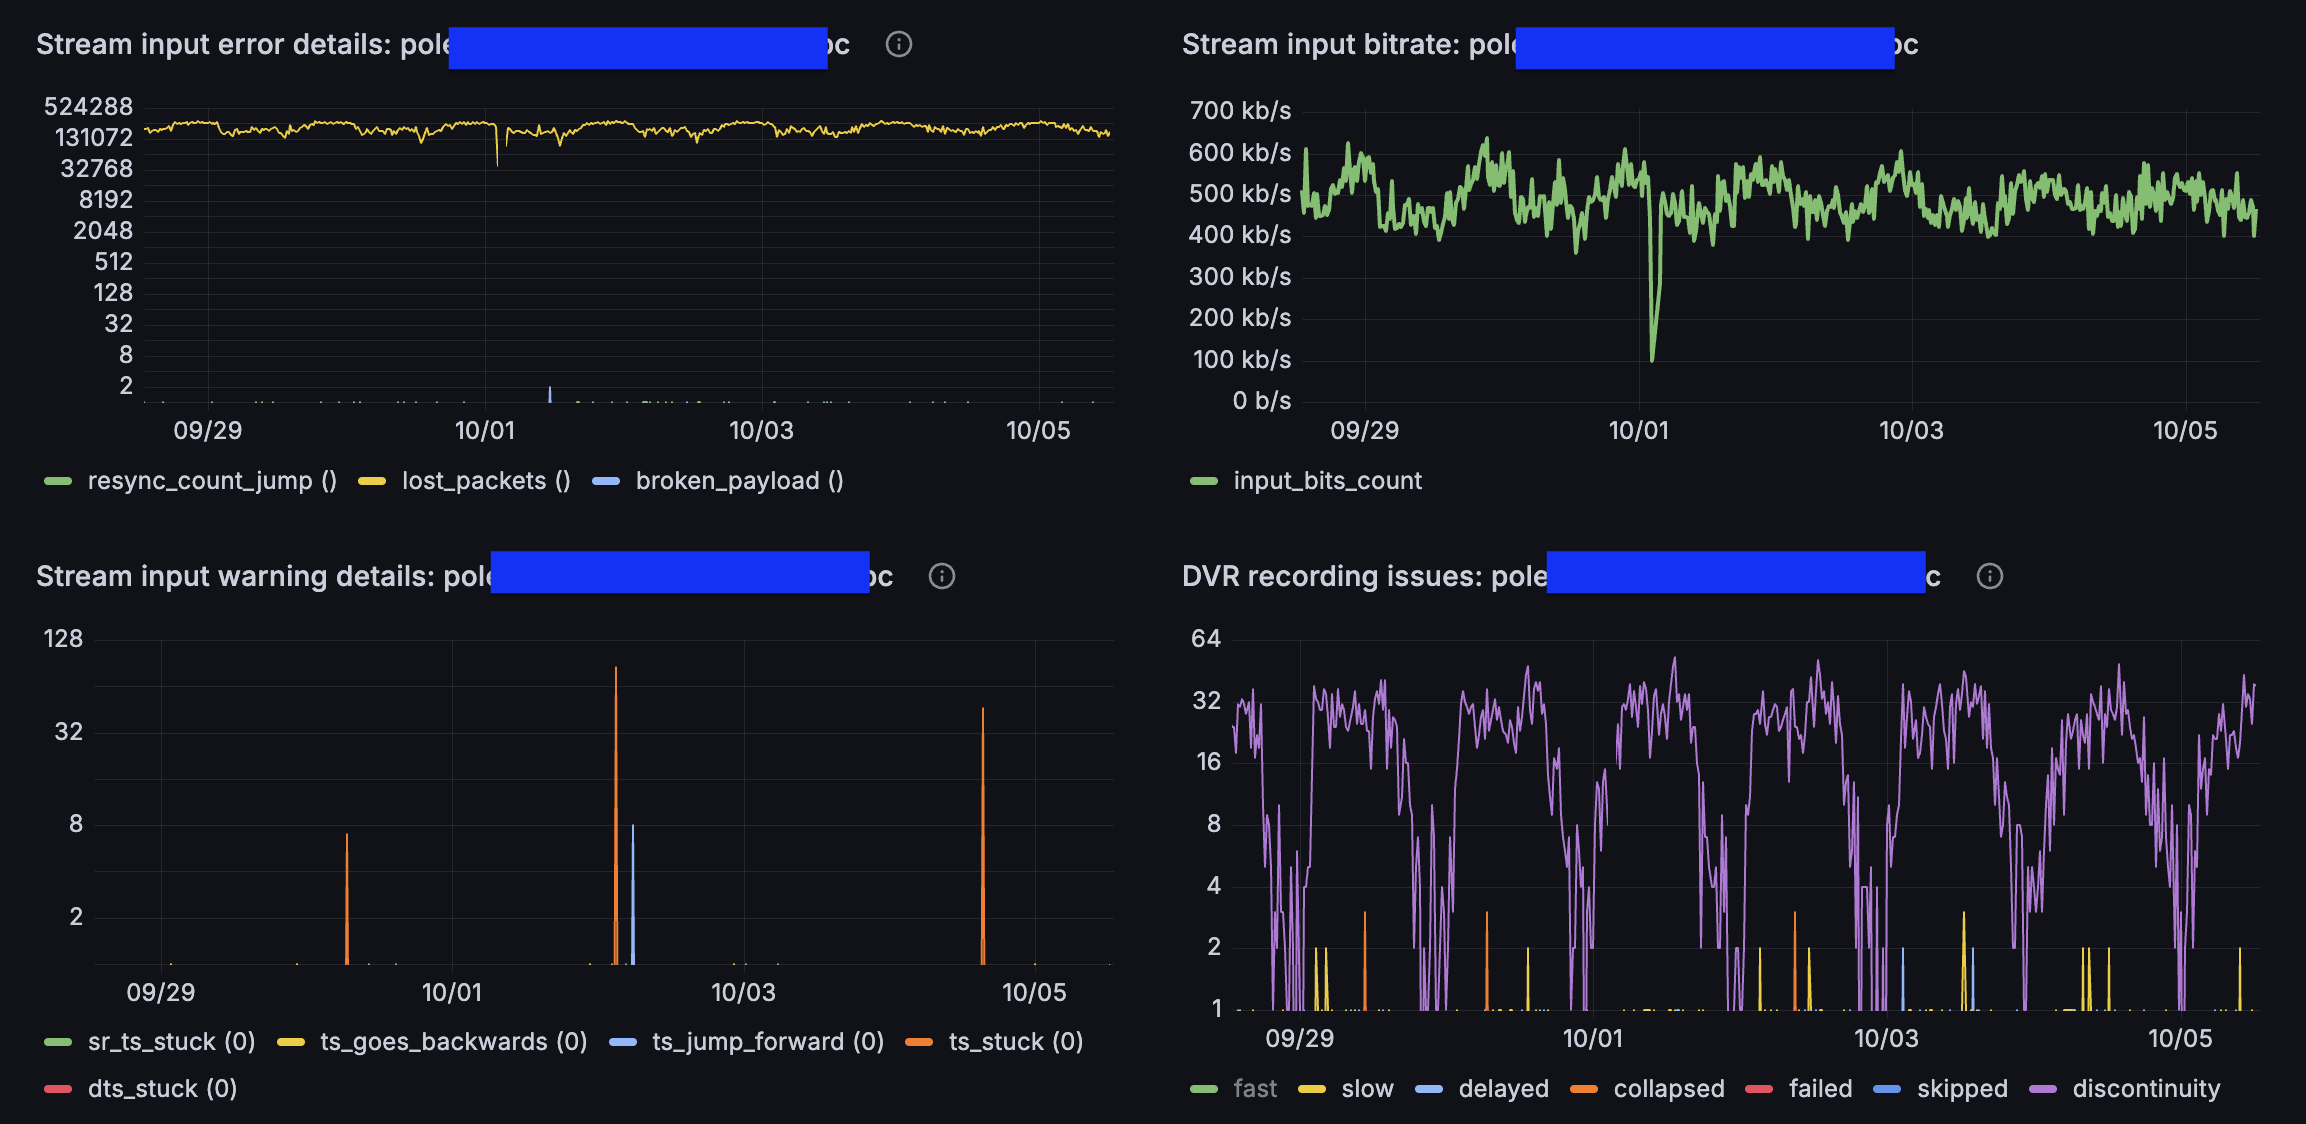
Pay attention to the following errors:
- discontinuity - means there are gaps in the stream. During playback there will be no seamless playback. Fix source
- failed - storage write attempt ended with error. Replace hard disk urgently
- skipped - couldn't write in time and started dropping segments. Abandon network storage, reduce hard disk load, abandon hardware RAID and switch to Flussonic RAID
- slow and delayed - means write was successful but dangerously long, more than half the segment duration itself
- collapsed - had to write several segments together. Not fatal, but this system won't handle more load growth