Unique Viewers Statistics
The Viewers stats dashboard shows unique viewers aggregated by IP address. Unlike the session statistics dashboard, it does not list every playback session with protocol and stream name — it answers how many distinct viewers watched, on which servers, and how much total traffic and time each IP consumed. For per-session details, go to Session Statistics.
Filters
At the top of the dashboard are variables that narrow the dataset before the query runs. All filters except Limit support multi-select and the All value (no restriction on that field).
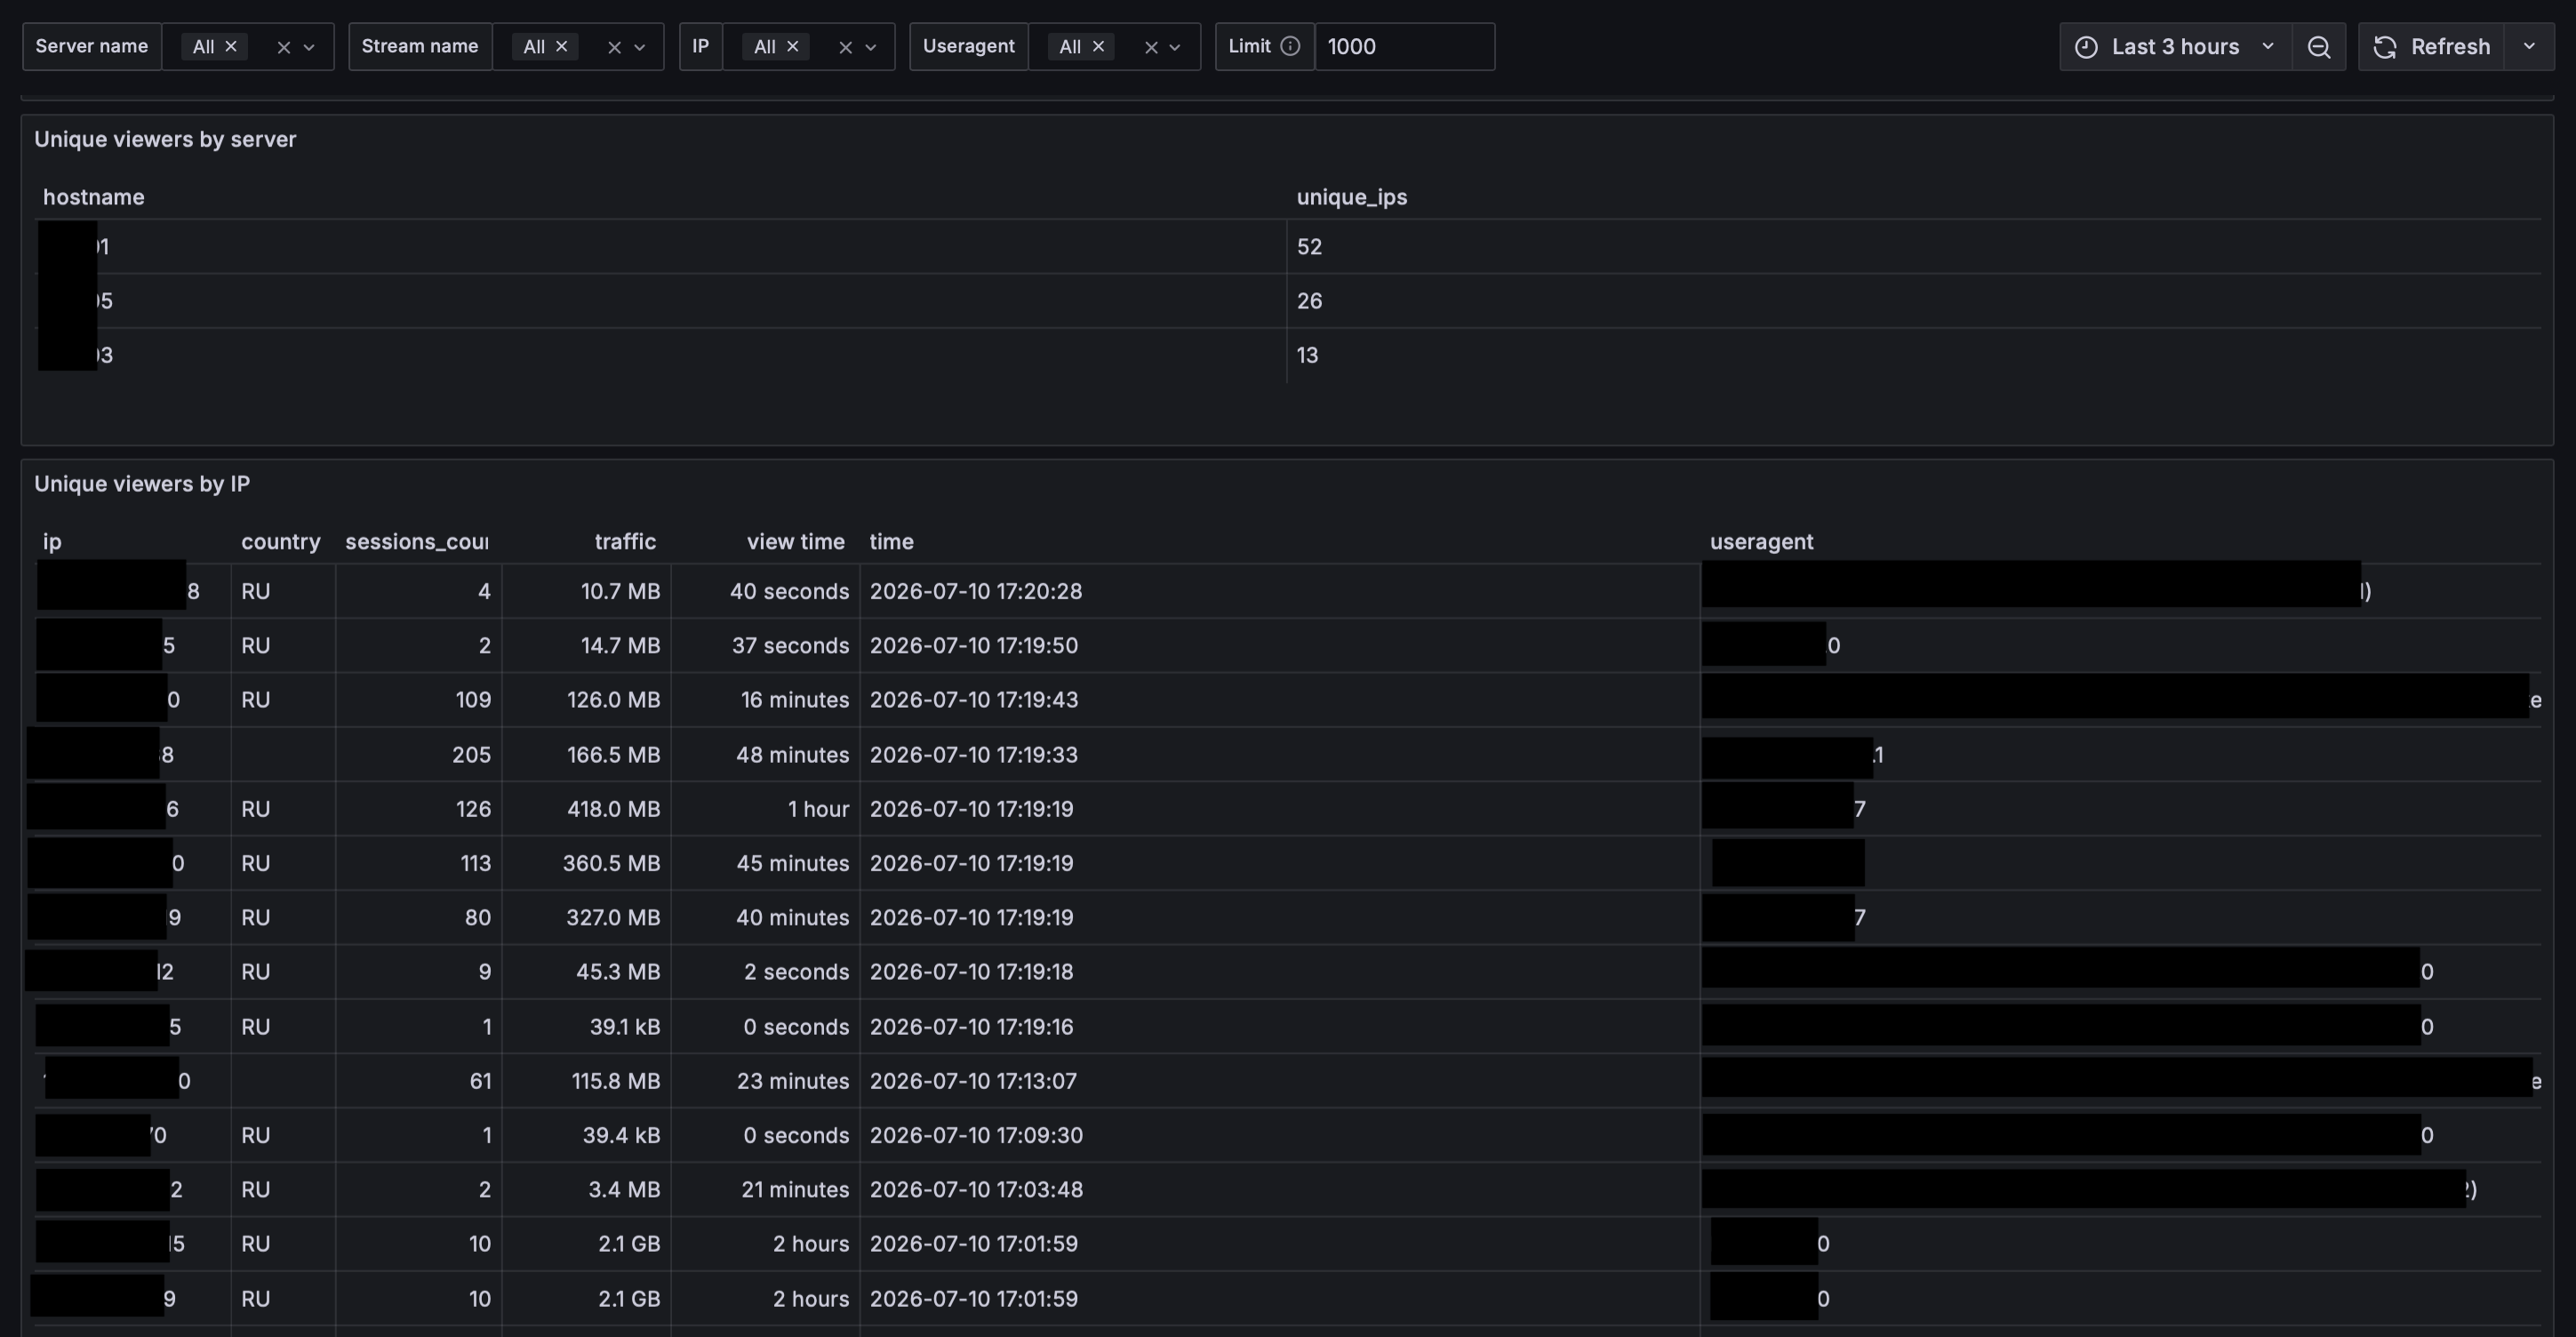
Server name
Filter by server (server_hostname). Lists servers that send viewer data.
Use when you need audience on a single cluster node only or to compare how many unique viewers each server serves. Selecting a server also narrows the list of available streams in Stream name.
Stream name
Filter by stream name (name). Depends on the selected Server name — only streams that have viewers on that server appear in the list.
Use to estimate the audience for a specific channel: select the stream and check how many unique IPs watched in the relevant interval. For protocol-level breakdown, open Session Statistics with the same filters.
IP
Filter by viewer IP address (ip).
Use to investigate a specific subscriber or CDN node: enter or select an IP and see aggregated sessions, traffic, and viewing time for the period. Works well together with a narrow time range in the top-right corner of Grafana.
Useragent
Filter by the client User-Agent string (useragent) — browser, app, set-top box, device model.
Helps find mass issues on one platform: "won't open in a specific browser", "broke after app update". You can select multiple user agents at once.
Limit
Text field for the maximum number of rows returned (default 1000, upper bound 50000).
The query is always capped at this number: with high traffic, not all viewers appear in the table — only the first N matching the query conditions. If rows are not enough — narrow filters (server, stream, useragent, time) or increase Limit, but very large values slow down the dashboard.
Time range
Top right — standard Grafana time picker (default last 3 hours). Viewer statistics are shown for the selected interval. For a complaint like "it did not work yesterday at 8 PM", narrow the range to that hour.
Unique Viewers by Server
The Unique viewers by server panel — a summary table of unique viewers per server. Columns can be sorted by clicking the header.

hostname
Server hostname that served viewers in the selected period.
unique_ips
Number of unique IP addresses that watched on this server. An overview metric for audience distribution across cluster nodes: which servers carry the most distinct viewers.
Unique Viewers by IP
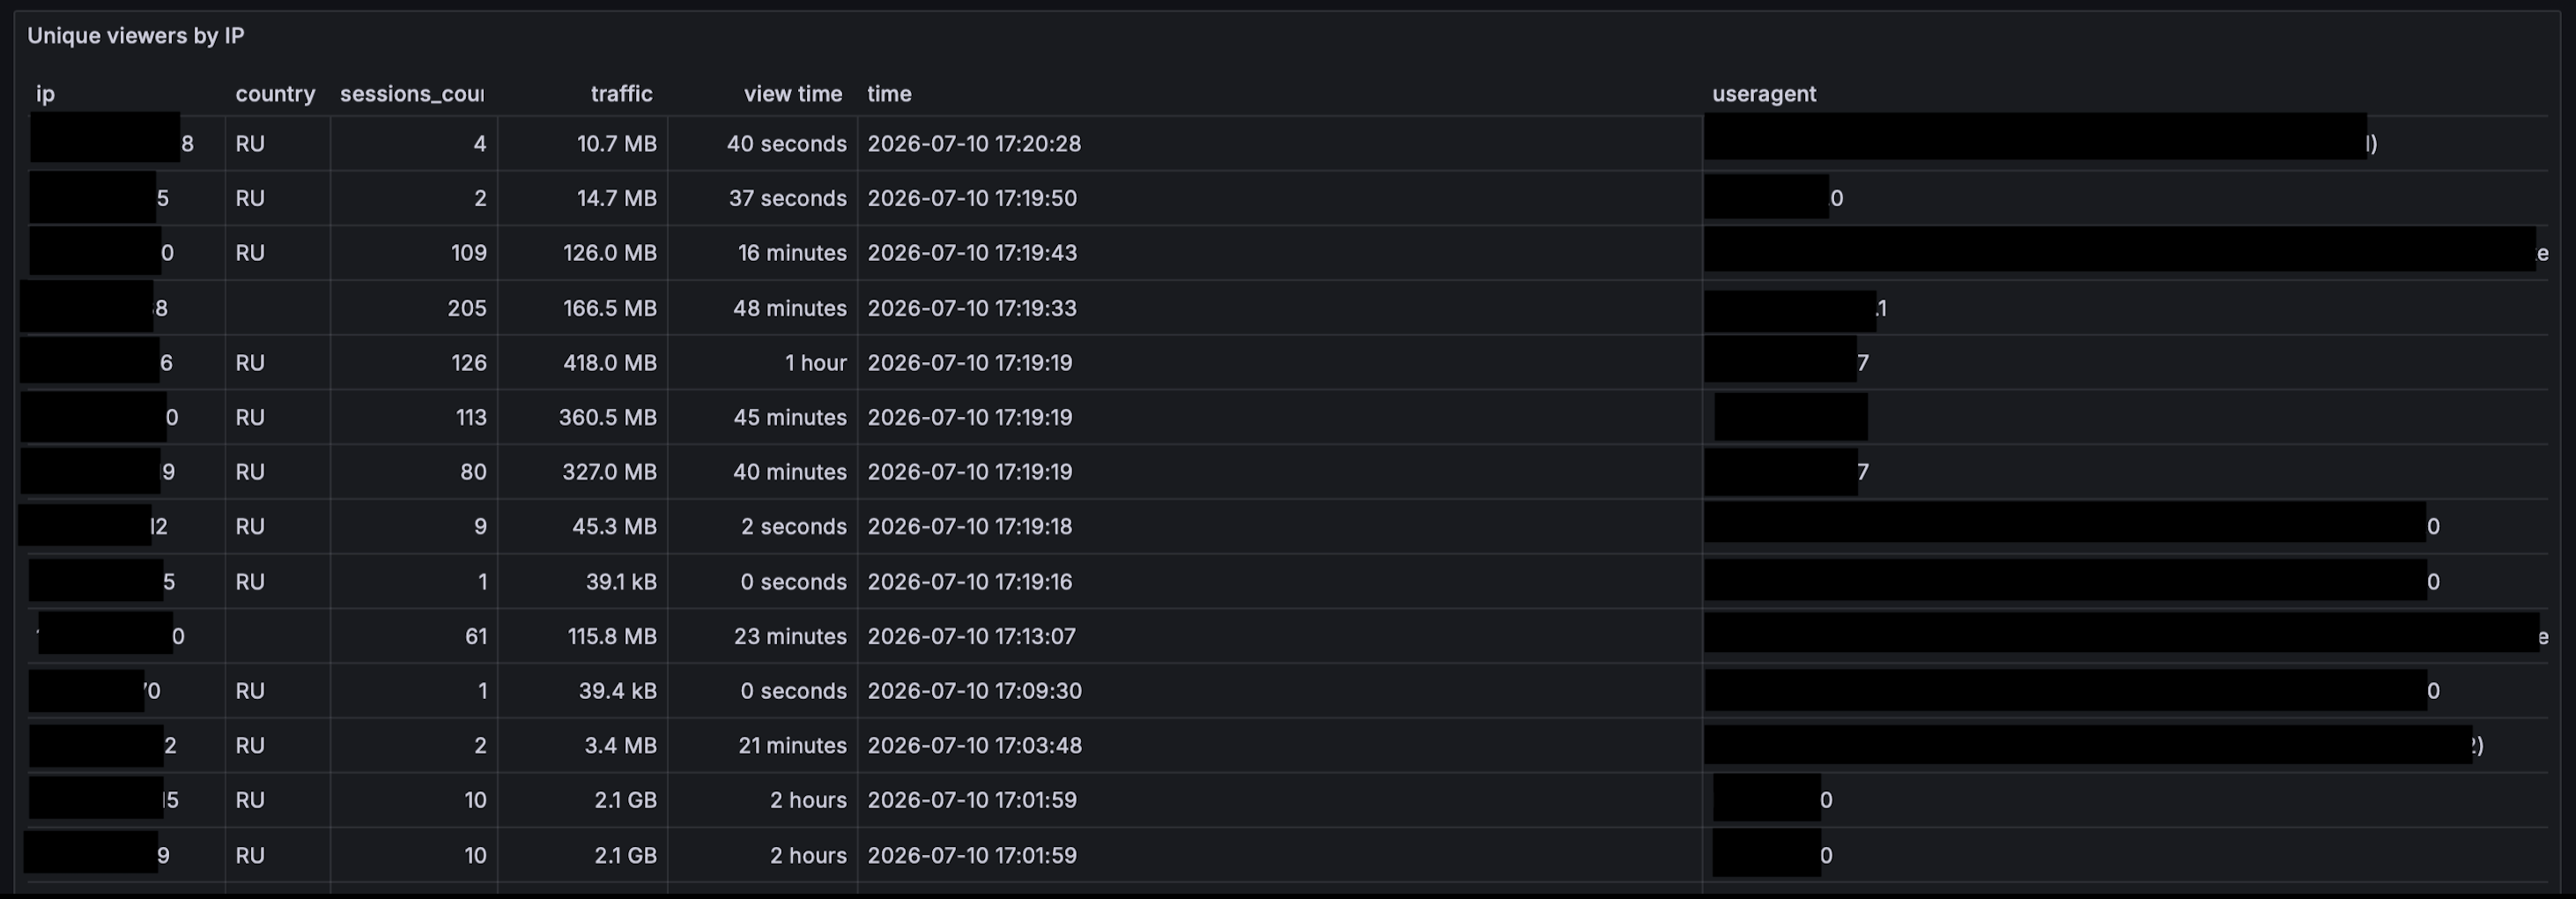
The Unique viewers by IP panel — aggregated statistics per viewer IP. Columns can be sorted by clicking the header (the screenshot shows sort by traffic descending — heaviest viewers at the top).
ip
Client IP address. One row per unique viewer in the selected period and filters.
country
Viewer country determined from IP. Empty value means geolocation is unavailable or the IP is local.
sessions_count
Number of playback sessions from this IP in the selected period. Higher than one means the viewer opened playback multiple times — different channels, reconnects, or devices behind the same NAT.
traffic
Total volume of data transferred across all sessions from this IP, in human-readable units (MB, GB). An indirect indicator of how heavily the viewer consumed streams. Unusually high traffic with many sessions_count may indicate archive downloading, repeated viewing, or a non-standard client.
view time
Total viewing duration across all sessions from this IP, in human-readable units (seconds, minutes, hours). How long this viewer actually watched in aggregate, not how long a single TCP connection lasted.
time
Metric record time (when the data was written). A reference for "when it happened", in the Grafana browser timezone.
useragent
User-Agent string — browser, OS, app, or set-top box. Correlate with sessions_count and traffic: the same issue on one user-agent across many IPs points to a client platform problem; on one IP with a normal user-agent — to the subscriber or network.
Use Cases
Subscriber complaint "I could not watch"
Set IP to the subscriber address, narrow time to the complaint interval. If the IP is absent — the viewer never reached the server (issue before Flussonic: network, authorization, DNS). If the IP is present but sessions_count is low and view time is only a few seconds — open Session Statistics for the same IP and check protocol and stream.
Finding heavy viewers or abuse
Sort Unique viewers by IP by traffic or sessions_count. IPs with very high traffic or session count may indicate archive downloading, restreaming, or automated clients.
Problem on one device type only
Filter by useragent or find recurring user agents with low view time while other devices show normal sessions_count.
Channel audience estimate
Set Stream name and review how many rows appear in Unique viewers by IP (within Limit). For exact per-session protocol breakdown, use Session Statistics.
Server audit
Server name + wide time range: compare unique_ips on the summary table with detailed rows on the IP table for that node.
Important: the dashboard shows viewers within Limit and the selected time range. For a full audit over 24 hours on a popular service, All alone may not be enough — combine filters and increase Limit as needed.