Cluster health
Health status is intended for the Watcher system administrator. It combines current camera and streamer availability with operating history for a selected period. Server settings are changed separately in Streamers.
Overview and tabs
There are six tabs:
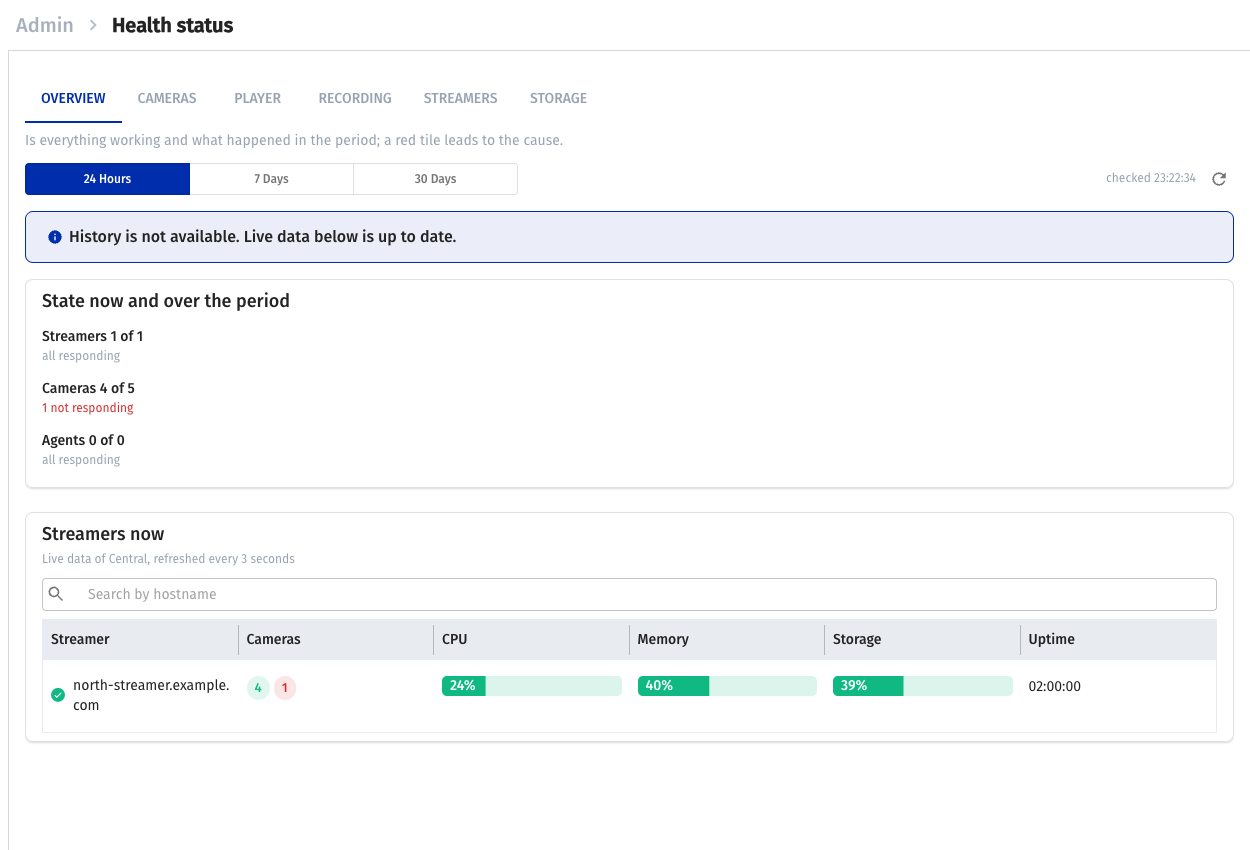
- Overview — current state, problems and events during the period, and a live streamer table. A problem tile opens details.
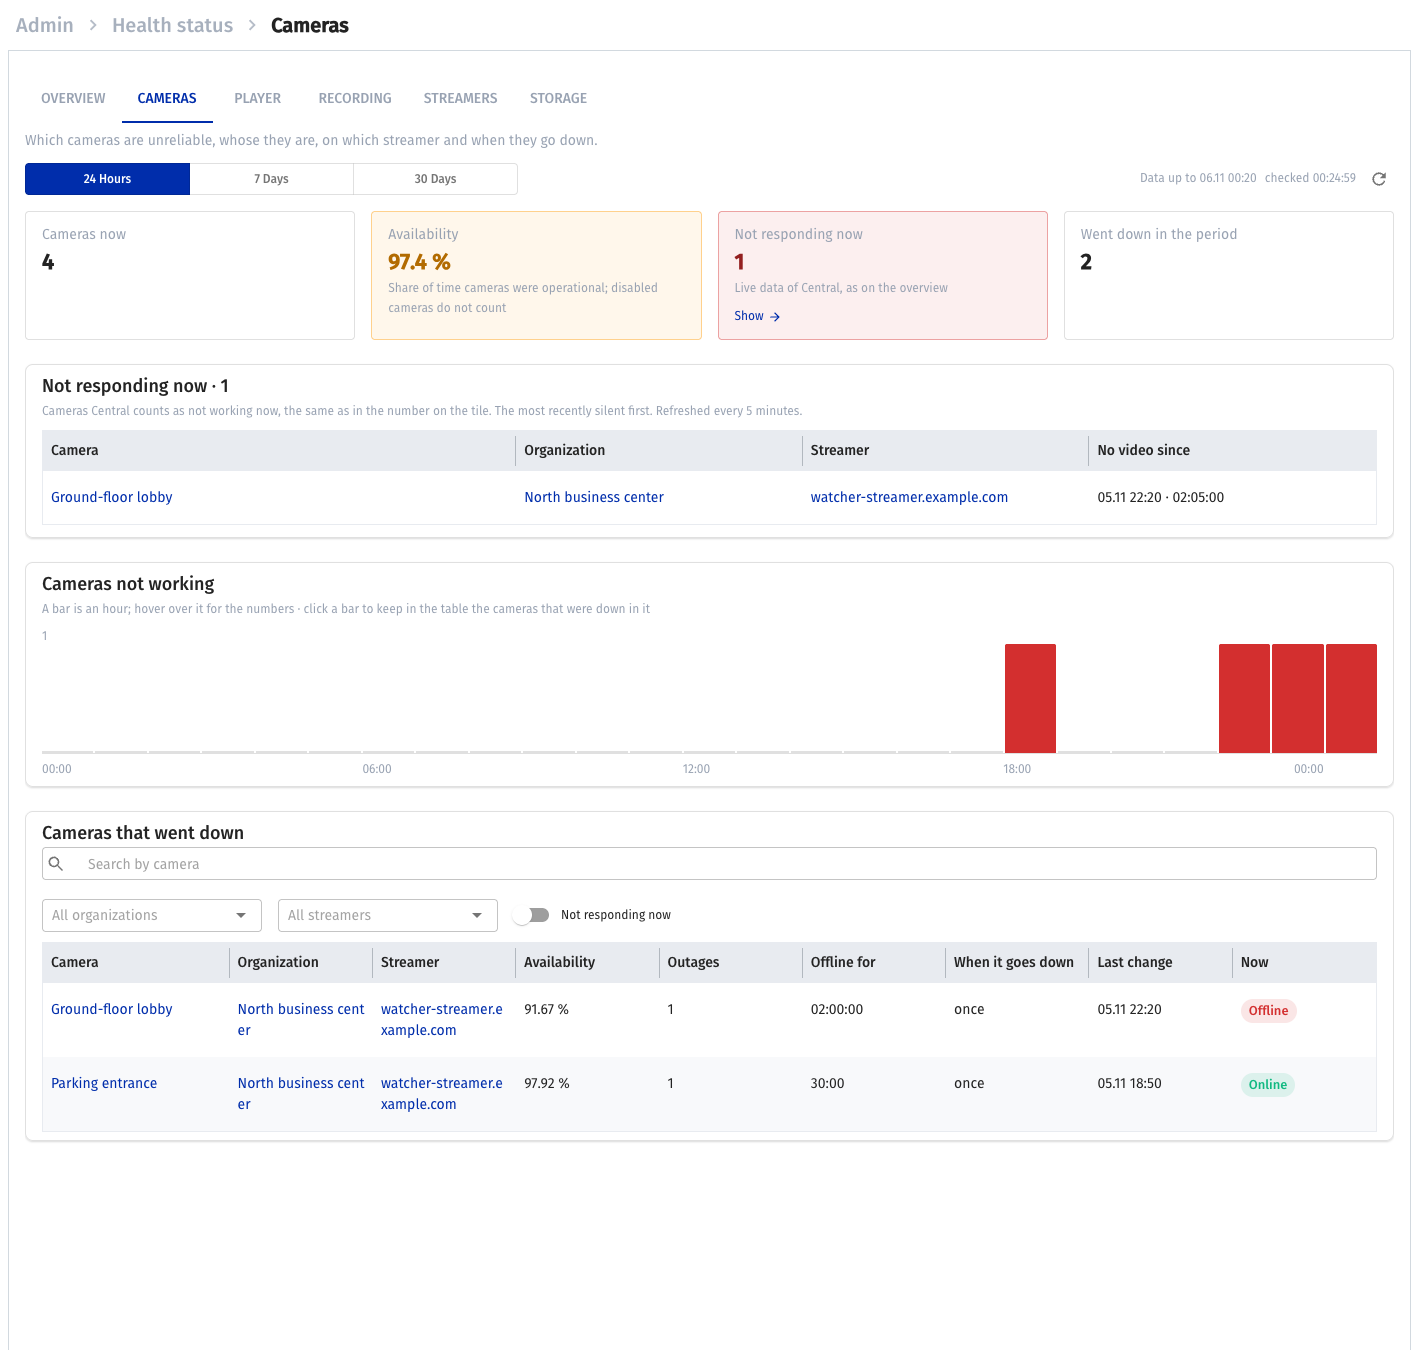
- Cameras — unavailable and unstable cameras, their organizations and streamers, and failure times.
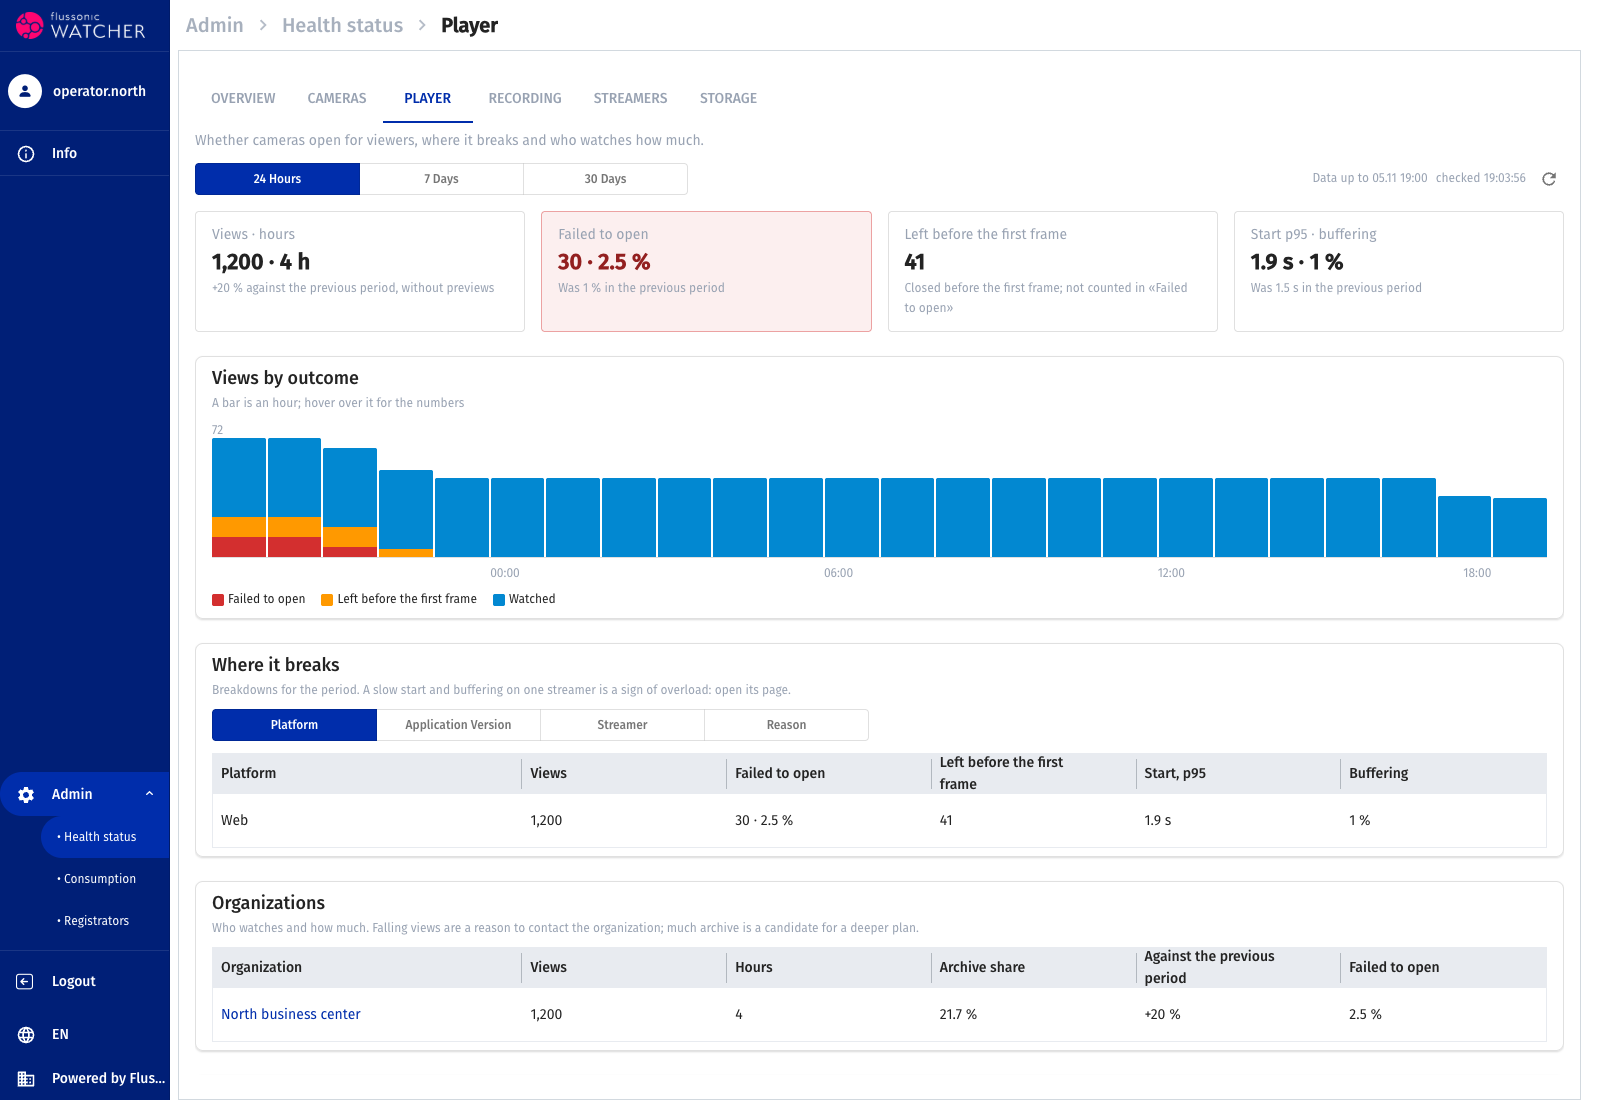
- Player — results of viewers opening cameras, errors and views.
- Recording — gaps and cameras whose archive was not fully recorded.
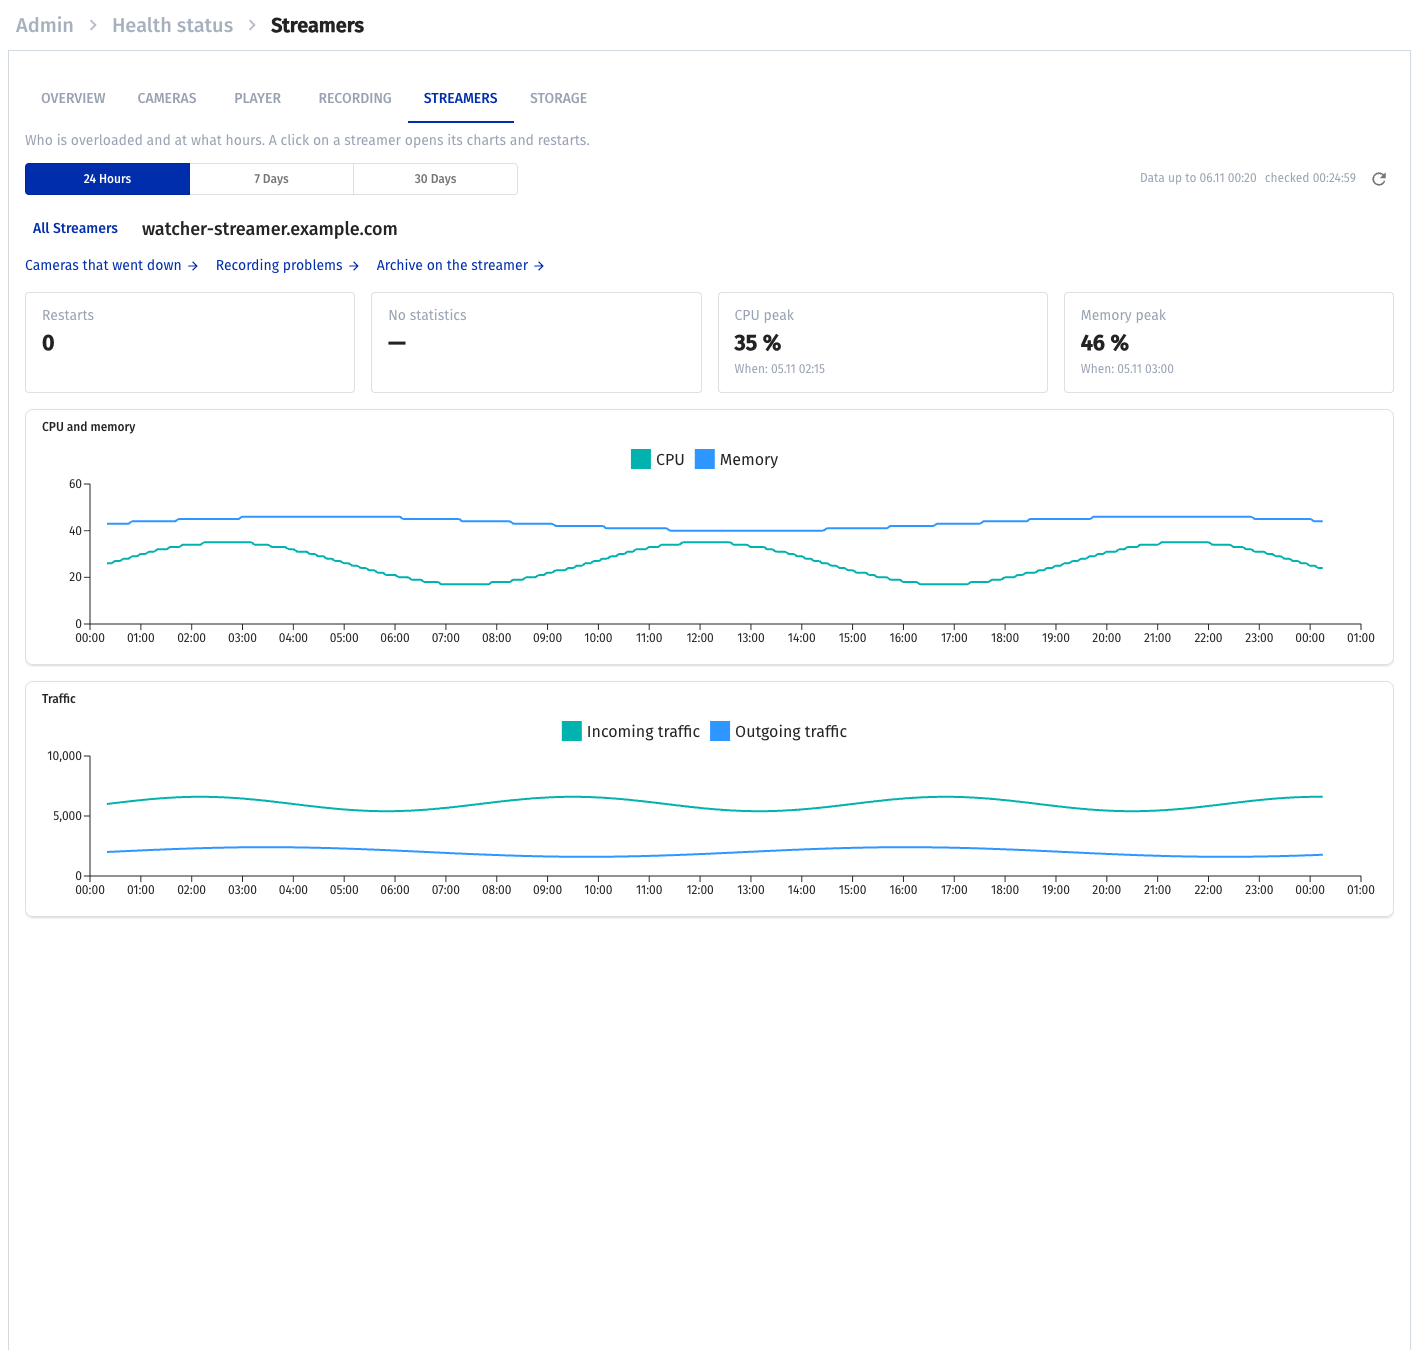
- Streamers — server load over time; selecting a server opens charts and restart information.
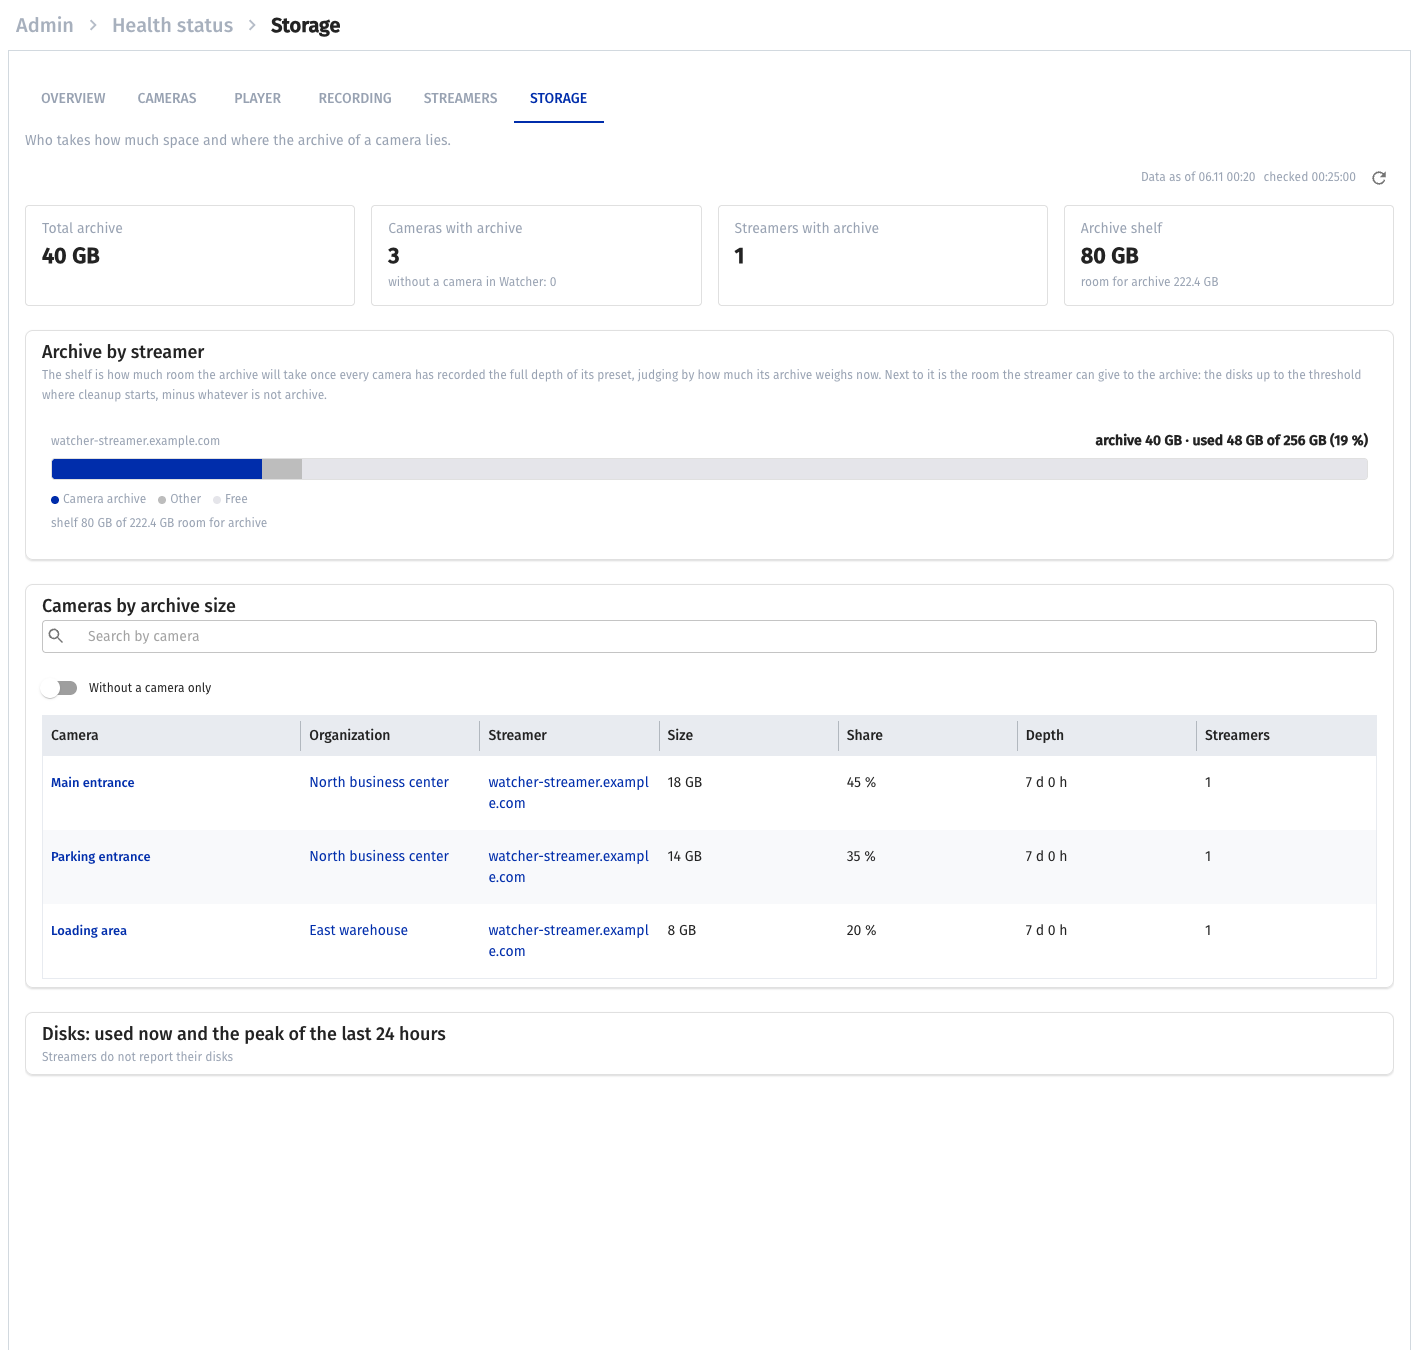
- Storage — archive space and camera archive placement.
Service and analytics usage history is in the separate Consumption section. It answers different questions and does not replace current availability checks.
Period and data freshness
History periods:
- 24 hours — detailed analysis of the last day.
- 7 days — a week of operation.
- 30 days — a month of operation.
The selected range is retained across history tabs. Tab-specific filters, such as a selected streamer, apply to that tab. Check them if an expected camera is missing.
Historical data refreshes separately from live state. Check the time through which history was received: missing recent points can indicate delayed or stopped collection. A chart gap must not be interpreted as zero load or healthy operation.
Storage shows a snapshot of archive placement and size; not every metric represents change during the selected period. Check each table's purpose before comparing it with recording history.
History tabs let you compare camera availability, streamer load and archive placement:
Current streamer state
On Overview, the table shows server availability, cameras, CPU, memory, storage and uptime. Historical problems supplement current values when history is available. A streamer name opens its settings.
Read metrics together. High CPU load does not prove video loss; check camera availability and recording. Free disk space does not rule out recording errors or slow storage operations.
On Streamers, compare load over time and open a particular server. Check whether changes in camera count or recording errors coincide with load peaks or restarts.
Player: investigate failed viewing
As a system administrator, open Health status → Player and select a period. This tab uses Watcher player telemetry; one view is one player session. Previews and mosaics are excluded. Only applications sending the required telemetry are counted, so a missing attempt does not prove the user never opened the camera.
Start with the summary tiles:
- Views · hours — view count and viewing time during the period.
- Failed to open — count and percentage of failed views.
- Left before first frame — views closed before the first frame, counted separately from failures.
- Start p95 · buffering — 95th-percentile time to first frame and buffering share. This is not every view's maximum delay.
The chart shows viewing outcomes over time. Below it, switch between Platform, Application version, Streamer and Reason to identify concentrations of failures. A streamer link opens its history for the same period. The organization breakdown compares view counts and viewing time across organizations.
For a particular user complaint, find Viewing attempts:
- In Login or camera, enter the user's login or part of a camera title or technical name. If a matching login is found, search applies to it; otherwise it searches cameras.
- Enable Failures only to retain unsuccessful attempts. This filter and search affect the attempts log, not other tab metrics.
- Compare time, camera, platform, application version, mode and failure reason. Open the camera or streamer if needed and check its state at the same time.
The log shows at most 200 recent matching attempts; camera search uses at most 50 matching cameras. The interface warns when results are limited. Narrow the period or query for more precise results.
If history exists but no player telemetry arrived during the period, a separate no-player-data message appears. This differs from an unavailable history source. Give support the time, camera and visible failure code; exclude token-bearing links.
Recording: find cameras with gaps
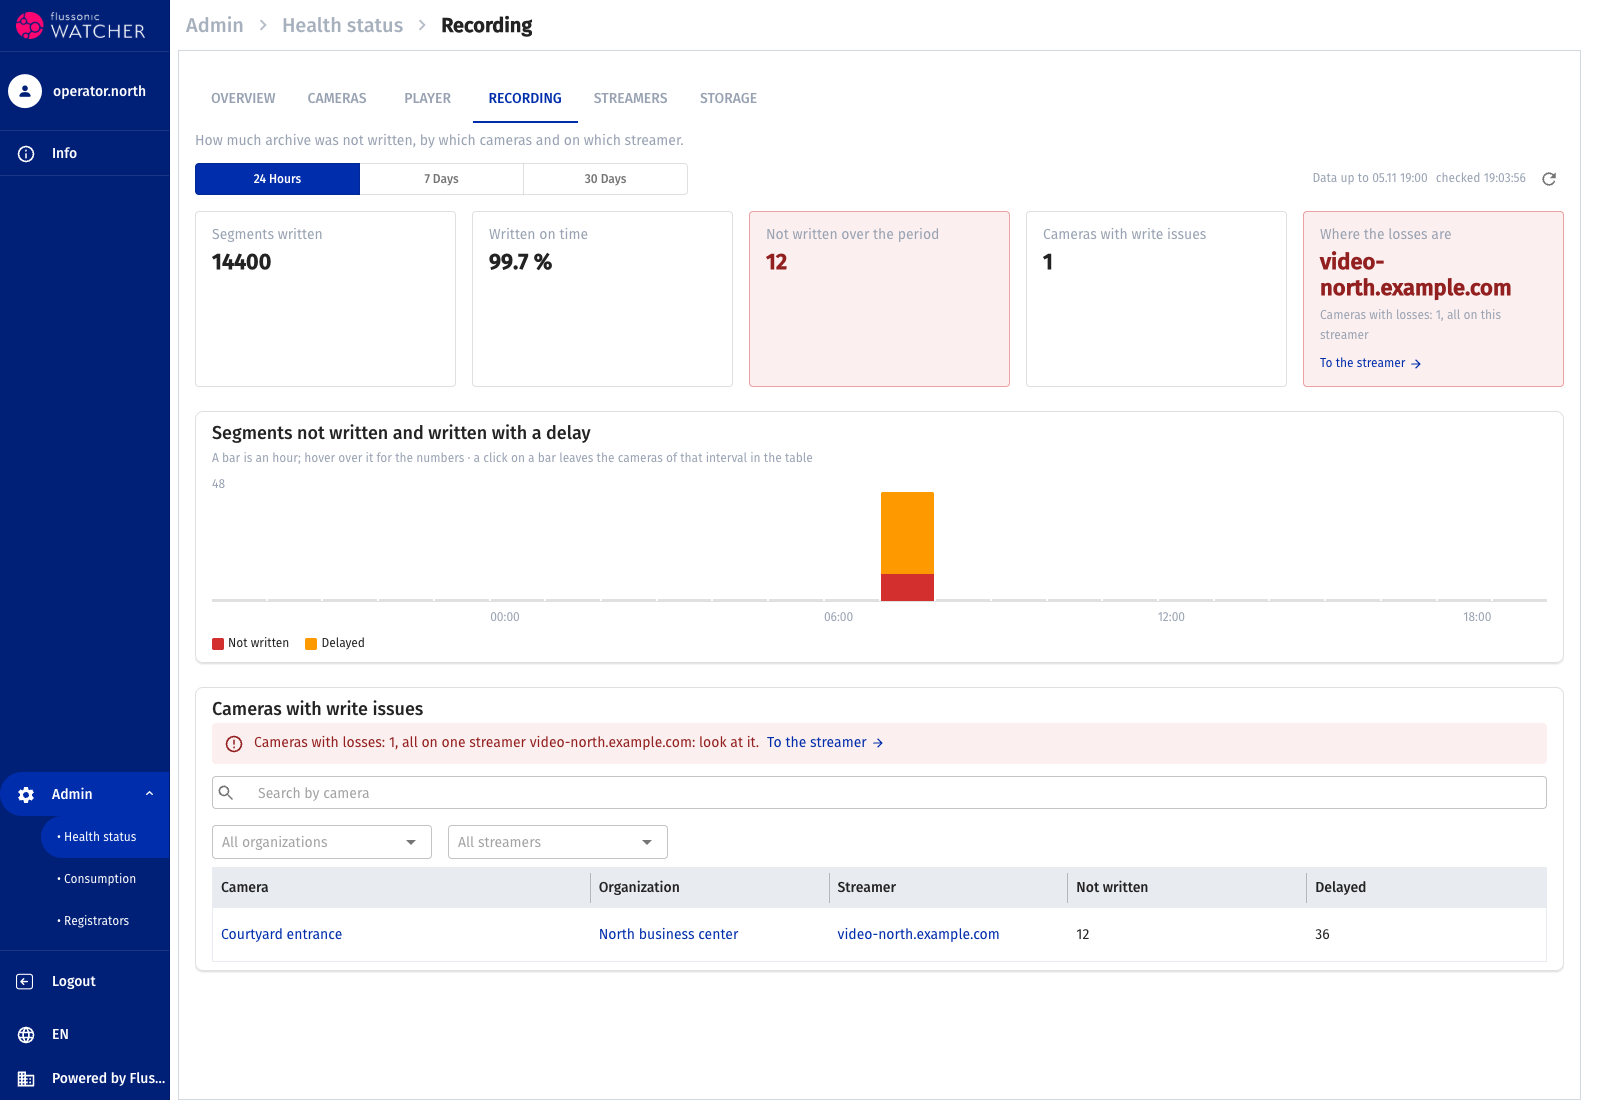
As a system administrator, open Health status → Recording and choose the period containing the problem. This tab shows segment recording quality and cameras with missing or delayed segments.
Not written over the period shows recording losses. Delayed segments must not be counted as lost. The on-time percentage and affected camera count show scale but do not replace checking the specific camera and interval.
- Find the affected time on Segments not written and written with a delay. If the source provided per-camera loss intervals, clicking a bar restricts the table to cameras in that interval. Remove the interval tag to return to the full period.
- Search cameras by title or technical name and use organization and streamer filters. Check those constraints if a camera is missing.
- Compare missing and delayed segment counts. Open the camera or streamer history and check the recording at that time.
If all known losses belong to one streamer and the source knows every affected camera's placement, Where the losses are links to its history. No such conclusion is made when placement is unknown. The table contains at most 100 cameras with the most serious problems; the total count can exceed the row count.
This tab describes recording history. Current disk usage and archive placement are under Storage. If the history source is unavailable or the chart has a gap, check the message and data freshness before concluding recording is absent.
Consumption
Consumption shows historical service use and video analytics results. It is available to Watcher system administrators separately from Health status. Use Health status tabs to check current camera and streamer availability.
Open Consumption in the administrator menu and select a tab. Both tabs provide 24 hours, 7 days and 30 days. Refresh history requests data again. Check the history-through timestamp: the latest point can lag behind current time. If history is unavailable, read the reason and follow Troubleshooting errors and warnings. Do not treat missing chart points as zero.
Usage
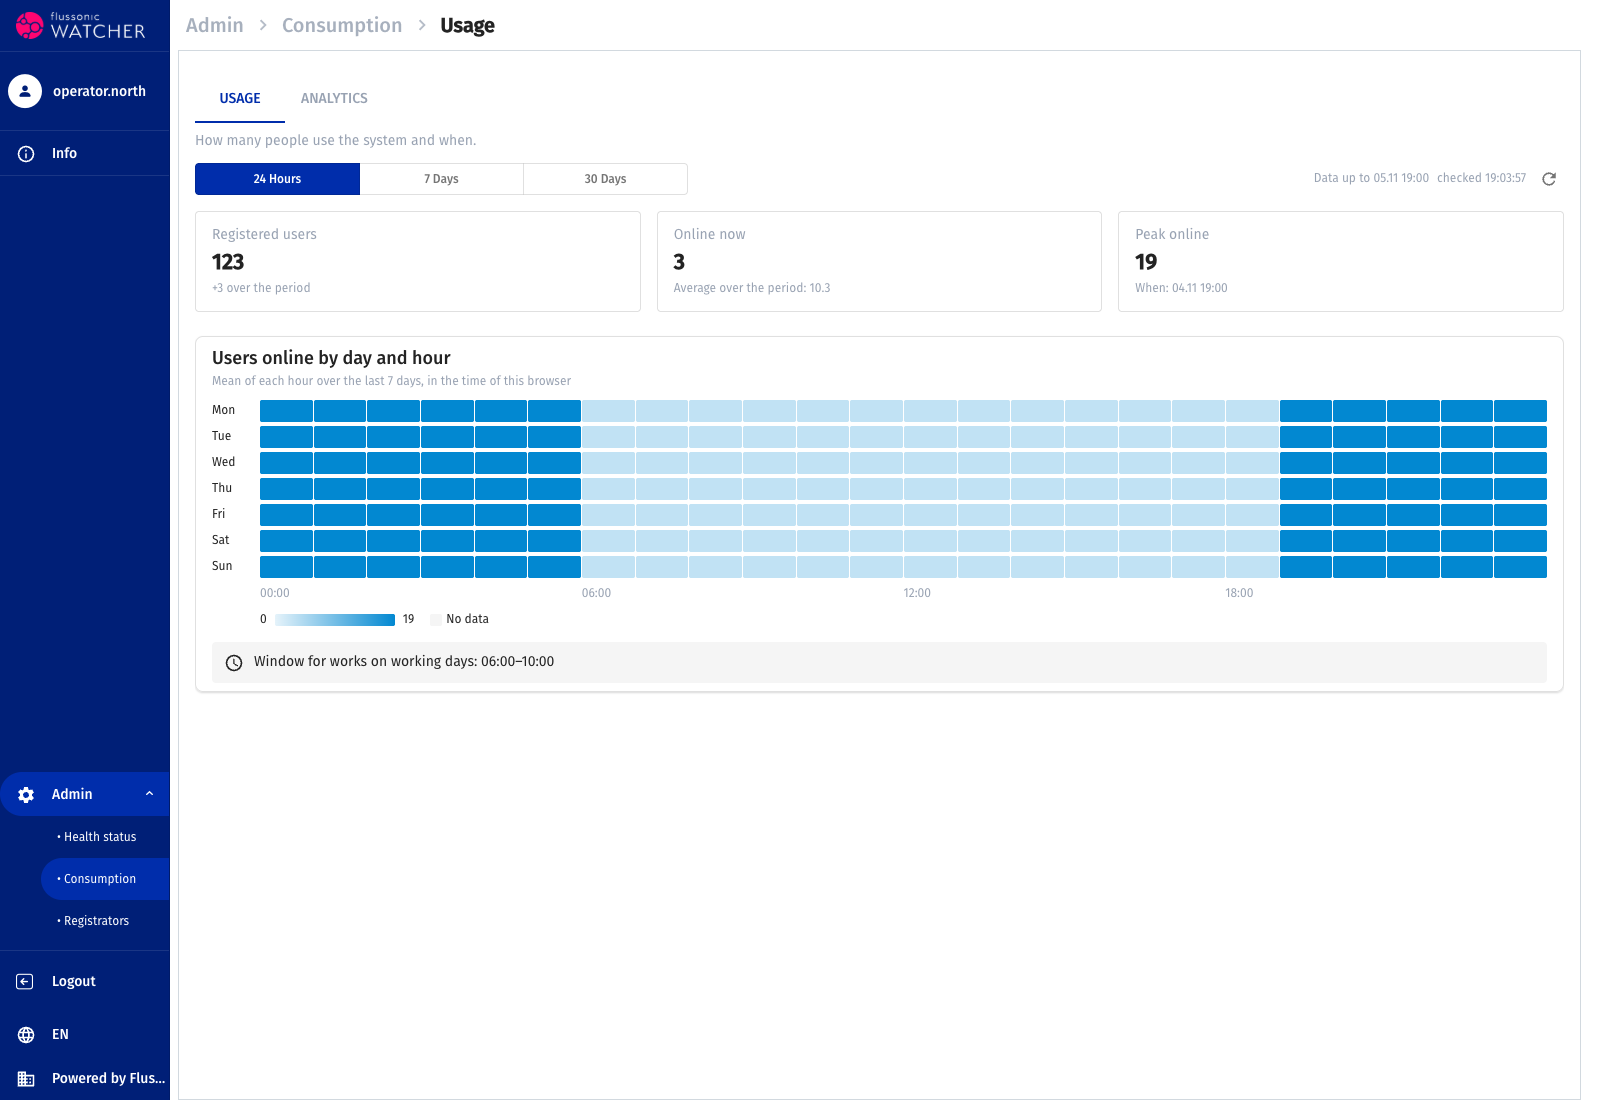
Choose Usage to assess user counts and lower-activity periods before maintenance.
- Registered users — latest known account count; the tooltip shows change during the period.
- Online now — latest known count of users with an active session, alongside the period average. This is not concurrent video stream count.
- Peak online — maximum active-session user count and the time of that peak.
Users online by day and hour always uses the latest seven days, even when another period is selected above. Each cell gives the average user count for that hour; days and hours use the browser timezone. A cell without data does not mean no users.
Window for works on working days may appear below the heatmap: a four-hour interval calculated from average activity. Compare it with your maintenance schedule; it does not guarantee nobody is using the system. If data is insufficient, the interface says so instead of suggesting a window.
Analytics
Choose Analytics to compare detector results and errors during the period. Metrics are summed across the Watcher installation.
- Episodes in the range — new episodes by type. Episodes by type shows their distribution over time.
- Face identification errors — error count for the period. The chart breaks them down by type; its explanation helps distinguish image problems from analytics node errors.
- Plates recognized — share of vehicle episodes with a recognized plate; the tooltip shows recognized and total vehicle episode counts.
- Cameras with analytics — latest received camera count and failed camera count. The chart shows status changes during the period.
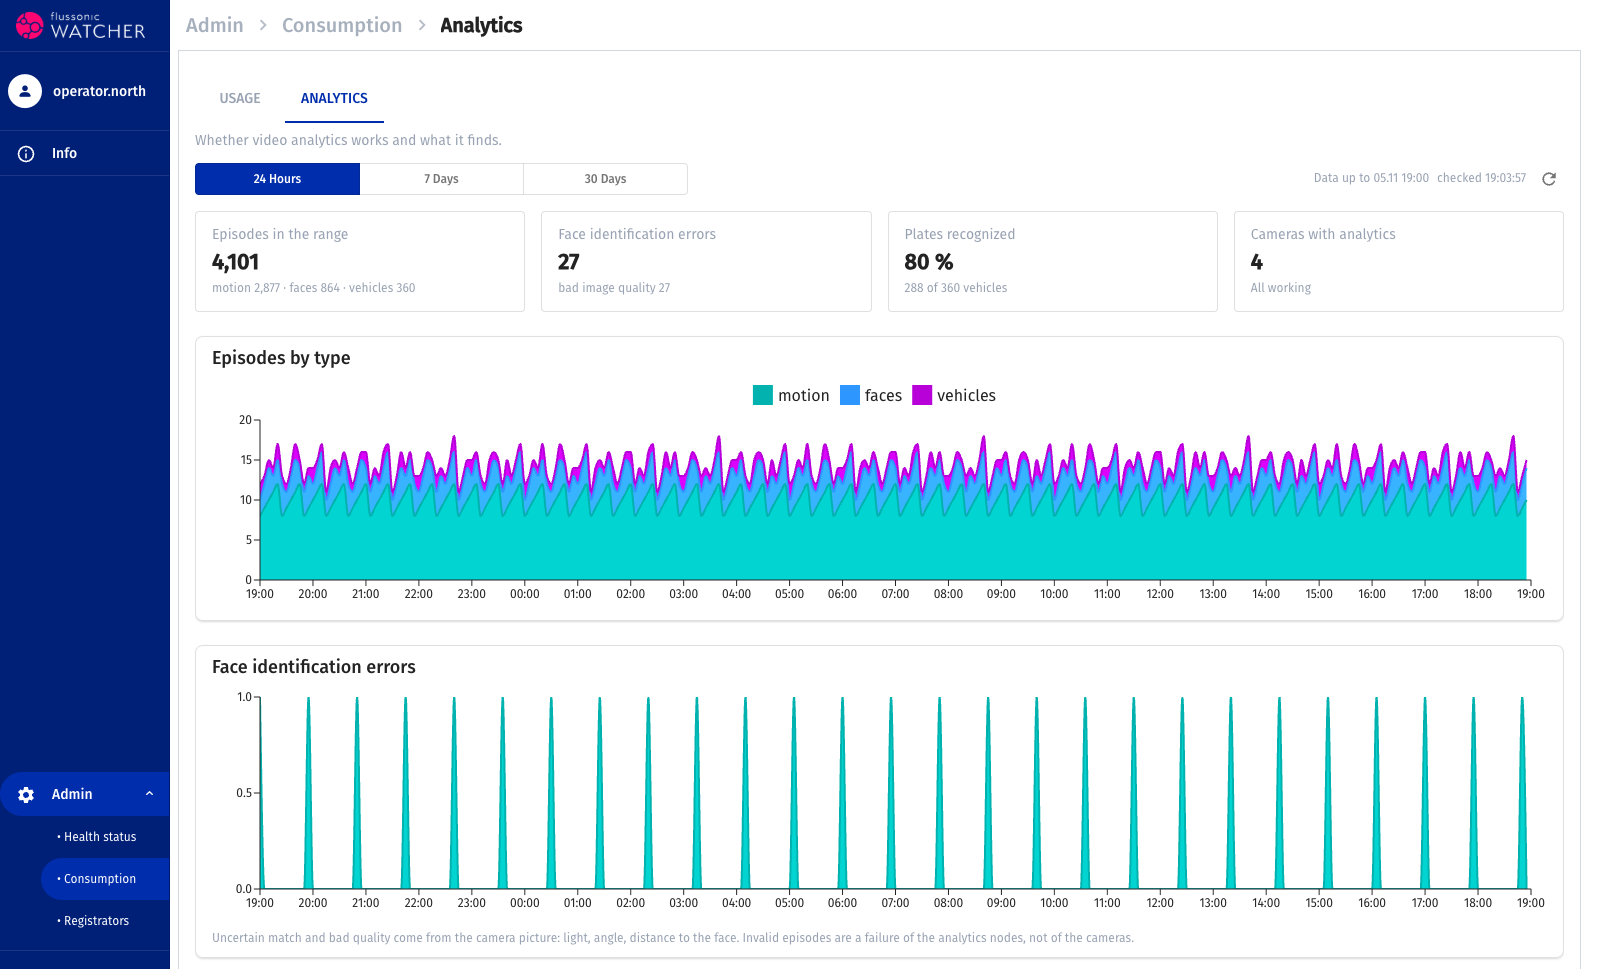
Only blocks for which the source supplied data appear. A missing block does not prove zero errors or failed analytics. No analytics data for the period has a separate message; an unavailable history source displays its reason. Investigate a particular event in the corresponding analytics episodes and compare its time with the chart.
Troubleshooting errors and warnings
Start with the affected object and time:
- Open a problem tile on Overview or the relevant tab.
- Select the affected period. Check data freshness and filters.
- Find the camera or streamer and compare availability, load and recording.
- On the streamer page, open State for connection and configuration check results.
- After fixing the cause, check new live video and a new archive interval.
Streamer checks can report API availability, cluster key, time synchronization and configuration. Fix the specific cause; a listed message does not mean the interface has fixed it automatically.
If history is unavailable, the interface shows the reason separately. Possible states:
- Statistics are not collected — no statistics for this installation during the period.
- History unavailable — data could not be retrieved from the history source.
- No streamer reports — the source lacks the required server reports.
Available live page sections continue to work. Missing history does not mean missing cameras, and a successful HTTP response does not guarantee historical collection is configured.
For a package installation, collect service state and logs:
systemctl --failed
systemctl status watcher-vms watcher-go central --no-pager
journalctl -u watcher-vms -u watcher-go -u central --since '-15 minutes' --no-pager
Remove secrets and personal data before sharing logs. Server settings are described under streamers; camera placement constraints are under zones.